The problem with partial duration series is that we wind up projecting from incomplete data. Cemetery sizes are larger in areas like the east coast, where towns have been present longer, than in Montana, where we’re just starting on our second century.
NOAA offers some perspective – not from models, but from evidence that geologists infer:
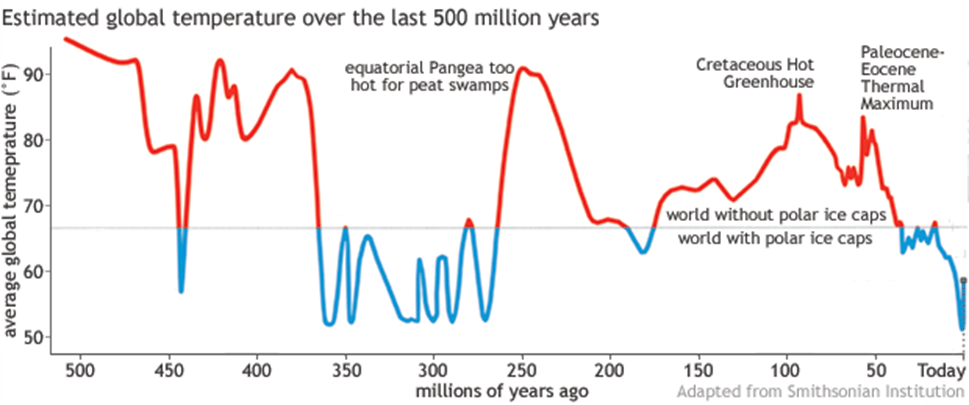
“A Smithsonian Institution project has tried to reconstruct temperatures for the Phanerozoic Eon, or roughly the last half a billion years. Preliminary results released in 2019 showed warm temperatures dominating most of that time, with global temperatures repeatedly rising above 80°F and even 90°F—much too warm for ice sheets or perennial sea ice. About 250 million years ago, around the equator of the supercontinent Pangea, it was even too hot for peat swamps!”
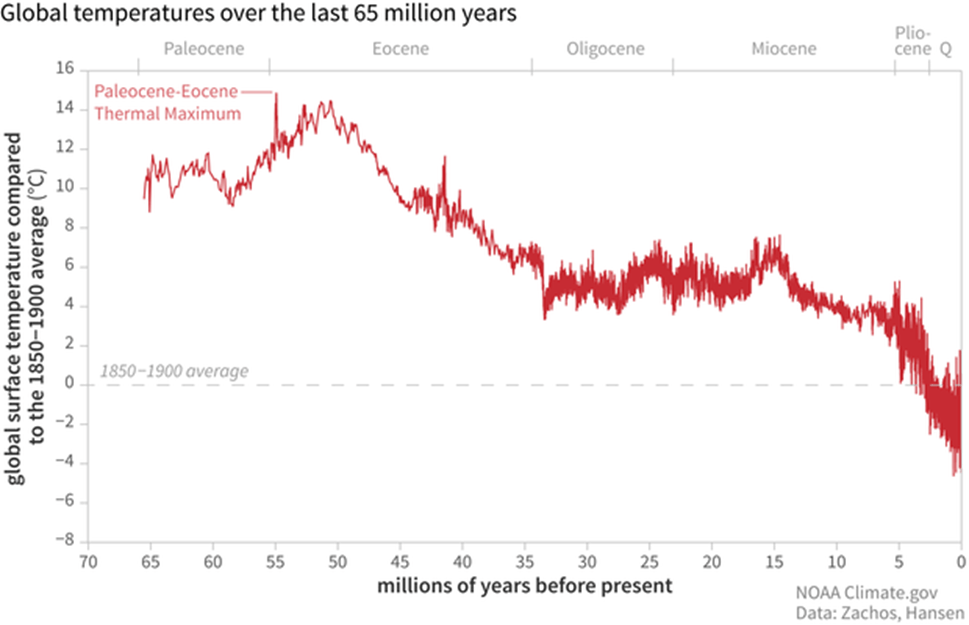
“Geologists and paleontologists have found that, in the last 100 million years, global temperatures have peaked twice. One spike was the Cretaceous Hot Greenhouse roughly 92 million years ago, about 25 million years before Earth’s last dinosaurs went extinct. Widespread volcanic activity may have boosted atmospheric carbon dioxide. Temperatures were so high that champsosaurs (crocodile-like reptiles) lived as far north as the Canadian Arctic, and warm-temperature forests thrived near the South Pole.
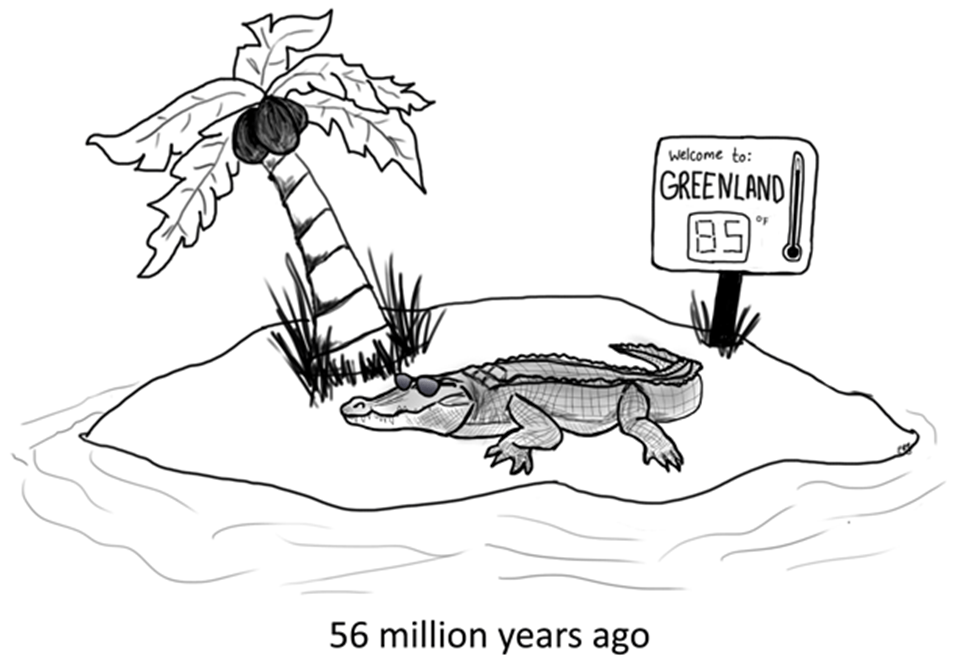
Another hothouse period was the Paleocene-Eocene Thermal Maximum (PETM) about 55-56 million years ago. Though not quite as hot as the Cretaceous hothouse, the PETM brought rapidly rising temperatures. During much of the Paleocene and early Eocene, the poles were free of ice caps, and palm trees and crocodiles lived above the Arctic Circle.”
The article is worth the click and the time to read. It gives a bit of a different perspective on climate – with any partial duration series, the interpretation of data depends on when you start and end the data. One of the texts I read as an undergraduate (possibly Ardrey?) said that man is an interglacial species – that the ice ages would not have allowed the development we have had. All of our agricultural development (and our later industrial accomplishments) came after the continental ice sheets retreated.
Another article at NOAA continues the discussion with:
“Natural variability can explain much of the temperature variation since the end of the last ice age, resulting from factors such as changes in the tilt of the Earth’s axis. Over the past century, though, global average temperatures have “risen from near the coldest to the warmest levels” in the past 11,300 years, the 2013 study authors explain. Over this same period, emissions of heat-trapping gases from human activities have increased.
Given the uncertainty inherent in estimating ancient temperatures, the scientists conservatively concluded that the last decade has brought global average temperatures higher than they have been for at least 75 percent of the last 11,300 years. The recent increase in global average temperature is so abrupt compared to the rest of the time period that when the scientists make a graph of the data, the end of the line is nearly vertical.”
The models show us one thing – the geological data another. “Since when?” isn’t a bad question – or answer. Click the links and enjoy the articles.

Leave a comment