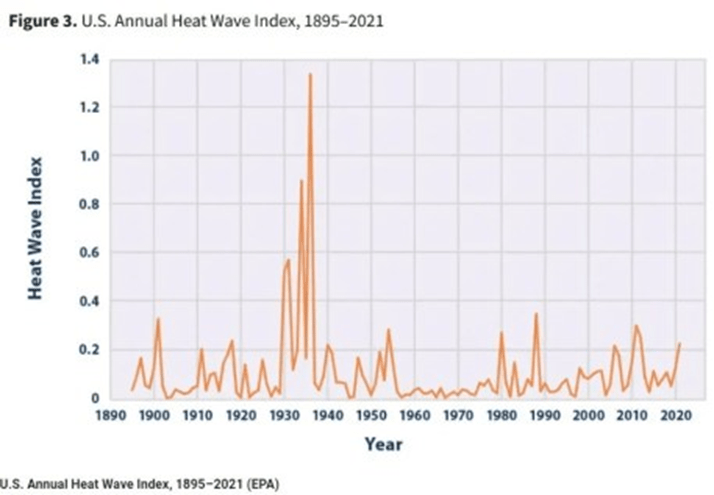
I noticed a post that shared a century’s worth of heat index data – then I checked the chart and it seems legitimate.
It’s no surprise to me – even as a sociologist, I was a rural sociologist, and part of the Ag department most of my career. As an aggie, and working on the plains, I know the legends from the Dust Bowl – and this chart definitely shows it. I guess it also shows that we had some cool summers in the sixties and seventies.
The “Dust Bowl” years of 1930-36 brought some of the hottest summers on record to the United States, especially across the Plains, Upper Midwest and Great Lake States. For the Upper Mississippi River Valley, the first few weeks of July 1936 provided the hottest temperatures of that period, including many all-time record highs (see tab below).
The string of hot, dry days was also deadly. Nationally, around 5000 deaths were associated with the heat wave.
In La Crosse, WI, there were 14 consecutive days (July 5th-18th) where the high temperature was 90 degrees or greater, and 9 days that were at or above 100°F. Six record July temperatures set during this time still stand, including the hottest day on record with 108°F on the 14th. The average high temperature for La Crosse during this stretch of extreme heat was 101°F, and the mean temperature for the month finished at 79.5°F – 2nd highest on record.
Several factors led to the deadly heat of July 1936:
A series of droughts affected the U.S. during the early 1930s. The lack of rain parched the earth and killed vegetation, especially across the Plains states.
Poor land management (farming techniques) across the Plains furthered the impact of the drought, with lush wheat fields becoming barren waste lands.
Without the vegetation and soil moisture, the Plains acted as a furnace. The climate of that region took on desert qualities, accentuating its capacity to produce heat.
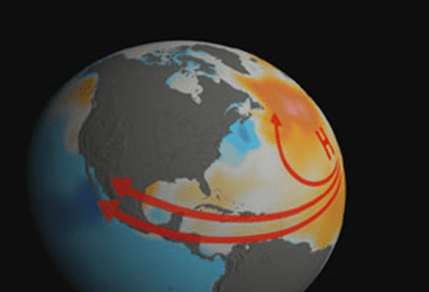
A strong ridge of high pressure set up over the west coast and funneled the heat northward across the Upper Midwest and Great Lakes.
“Siegfried Schubert of NASA’s Goddard Space Flight Center, Greenbelt, Md., and colleagues used a computer model developed with modern-era satellite data to look at the climate over the past 100 years. The study found cooler than normal tropical Pacific Ocean surface temperatures combined with warmer tropical Atlantic Ocean temperatures to create conditions in the atmosphere that turned America’s breadbasket into a dust bowl from 1931 to 1939. The team’s data is in this week’s Science magazine.
These changes in sea surface temperatures created shifts in the large-scale weather patterns and low level winds that reduced the normal supply of moisture from the Gulf of Mexico and inhibited rainfall throughout the Great Plains.
“The 1930s drought was the major climatic event in the nation’s history,” Schubert said. “Just beginning to understand what occurred is really critical to understanding future droughts and the links to global climate change issues we’re experiencing today.”
By discovering the causes behind U.S. droughts, especially severe episodes like the Plains’ dry spell, scientists may recognize and possibly foresee future patterns that could create similar conditions. For example, La Niñas are marked by cooler than normal tropical Pacific Ocean surface water temperatures, which impact weather globally, and also create dry conditions over the Great Plains.
The old Chinese curse is supposed to be “May you live in interesting times.” From a weather and climate perspective, it seems we continue to live in interesting times.


Leave a comment