There’s a fairly simple formula for indexing housing affordability. If you have the mean family income, and go to purchase a house at the mean cost, and qualify exactly for a mortgage, the index is 100. A higher number – say 110 – means that housing is more affordable. A lower number – say 90 – means that housing is less affordable.
It’s a simple calculation – and the National Association of Realtors keeps track of what homes sell for – making that information available to their members (and to everyone else, though there are copyright considerations in publishing their data).
This graph, taken from The Kobeissi Letter, shows how increasing affordability and decreasing affordability works . . . the GS stands for Goldman Sachs – folks who have a definite business interest in the topic:
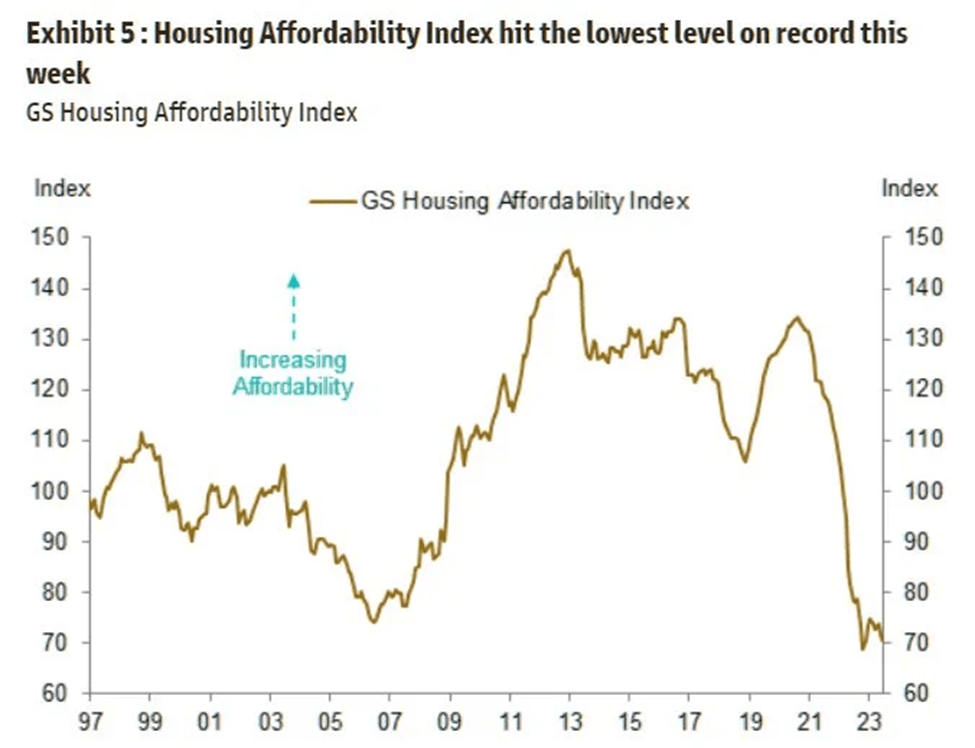
Basically, the index is determined by interest rates, house prices and family incomes. Simple equations are a lot easier to understand – and graphs are a lot more self-explanatory than lists of numbers.
So, if we check the American Community Survey, the mean household income for Montana was $63,249 in 2021 (2023 stats are due in September). Glancing at Zillow this morning showed the average home value for 59917 (Eureka ZIP code) is $520,698. Since that household income is lower than the national average, the chart above isn’t particularly relevant here – but the index does show a trend.
The US bond rating dropped from AAA to AA+. That’s not particularly frightening if you see that BBB is the break point between investment quality and junk bonds. An outfit called Fitch determines the bond ratings for governments – List of countries by credit rating – Wikipedia shows where most countries rate . . . Sweden and Switzerland held their AAA ratings, Ukraine is at CC, so seems a poor credit risk.
Inflation can – and often does – exceed interest rates, effectively making all bonds junk bonds. The problem is that the dollar’s purchasing power drops faster than the interest rate. US Inflation Rate by Year: 1929-2023 show most of the last century’s inflation (and deflation) by years with very brief explanations. It’s worth looking at.
The table below, taken from Current US Inflation Rates: 2000-2023 shows the annualized inflation rates over the past two Presidential administrations.

The past five years interest rates, in a chart taken from United States Fed Funds Rate – 2023 Data – 1971-2022 Historical – 2024 Forecast provide a perspective where you can visualize how inflation overcomes interest – basically forcing people to move from saving to speculating.

Unfortunately, most of our elected officials who are in positions to make financial decisions lack the skills to make good decisions.

Leave a comment