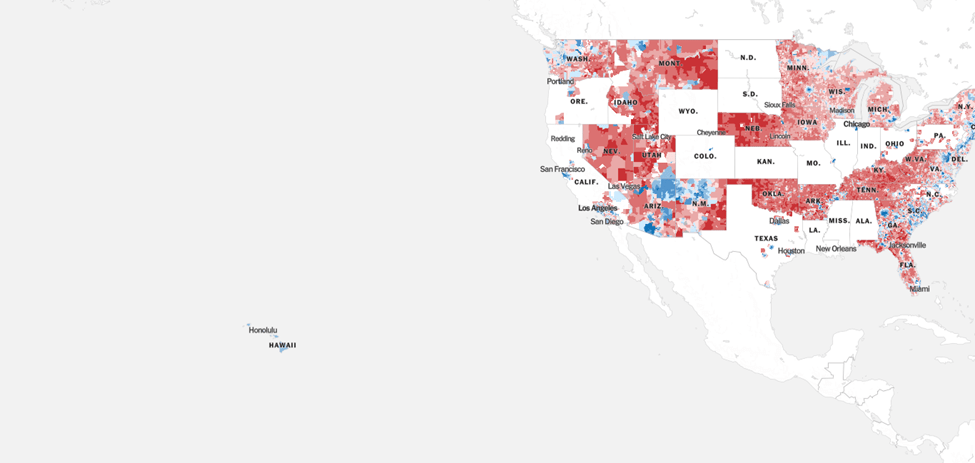
I don’t feel the need to subscribe to the New York Times – but there are occasions when the newspaper provides great information. This time, it’s a map that shows how various areas voted in the last presidential election. You can find it at: An Extremely Detailed Map of the 2024 Election Results: Trump vs. Harris – The New York Times .
If nothing else, it’s a quick and easy way to check out your own neighborhood: Lincoln County went 76% Trump, 22% Harris. I’m a 2 percenter – confident that Montana wasn’t a swing state, I could vote Libertarian to help a third party stay on the ballot in future elections.
Now the real Trump stronghold was Garfield County -756 votes for Trump,39 for Harris. On the other hand, Gallatin County (MSU) went 50% Harris, 47% Trump. Missoula was 59% Harris, 38% Trump.
The map’s not complete yet – I was interested in seeing how Kern County (Bakersfield, California) voted so I could compare it with Lincoln County – my unscientific observation is that our Bakersfield immigrants are more conservative than our long-term Montanans. Unfortunately, the map is not yet complete, so I can’t get that data – nor for Trinidad, Colorado or Brookings, SD. Still the link should be good for a while – click and check.

Leave a comment