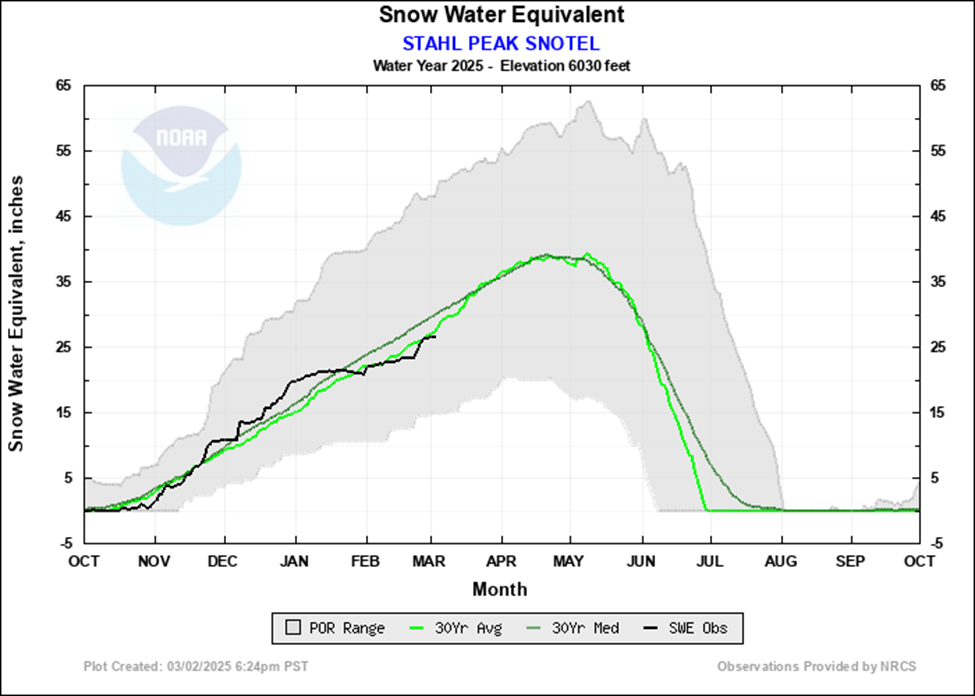
With the first of March, Stahl Peak is back to 96% of average snowpack. The chart shows how the snow water equivalent was above average in January, fell below average through February, and came close to average for March 1. As you can see, the month of March is the most significant time in determining how much water will be sitting up in the mountains.
The basin index – available at Montana SNOTEL Snow/Precipitation Update Report shows that Grave Creek is the only pillow reporting above average. It is fun to be able to see all the measurements from an easy chair, compared with the oversnow trips we made with the Alpines fifty years ago.
| Basin Site Name | Elev (ft) | Snow Water Equivalent | Water Year-to-Date Precipitation | ||||
| Current (in) | Median (in) | Pct of Median | Current (in) | Median (in) | Pct of Median | ||
| KOOTENAI RIVER BASIN | |||||||
| Banfield Mountain | 5580 | 12.7 | 14.2 | 89 | 16.4 | 20.9 | 78 |
| Bear Mountain | 5460 | 40.2 | 45.2 | 89 | 43.9 | 57.3 | 77 |
| Garver Creek | 4250 | -M | 8.5 | * | -M | 15.4(24) | * |
| Grave Creek | 4350 | 13.9 | 13.7 | 101 | 21.0 | 26.8 | 78 |
| Hand Creek | 5040 | 8.9 | 9.4 | 95 | 11.0 | 14.4 | 76 |
| Hawkins Lake | 6460 | 18.0 | 21.0 | 86 | 23.6 | 25.6 | 92 |
| Poorman Creek | 5050 | 24.1 | 30.7(22) | 79 | 32.0 | 47.0(22) | 68 |
| Stahl Peak | 6040 | 26.4 | 27.2 | 97 | 27.6 | 31.4 | 88 |
| Basin Index (%) | 89 | 79 | |||||

Leave a comment