We know that how a question is asked can influence the answers – and that, along with other factors such as sampling bias creates polls that are proven wrong in following elections. I’m going to illustrate how to better understand polls by showing some that were taken on gun ownership during the first 24 years of the new century:
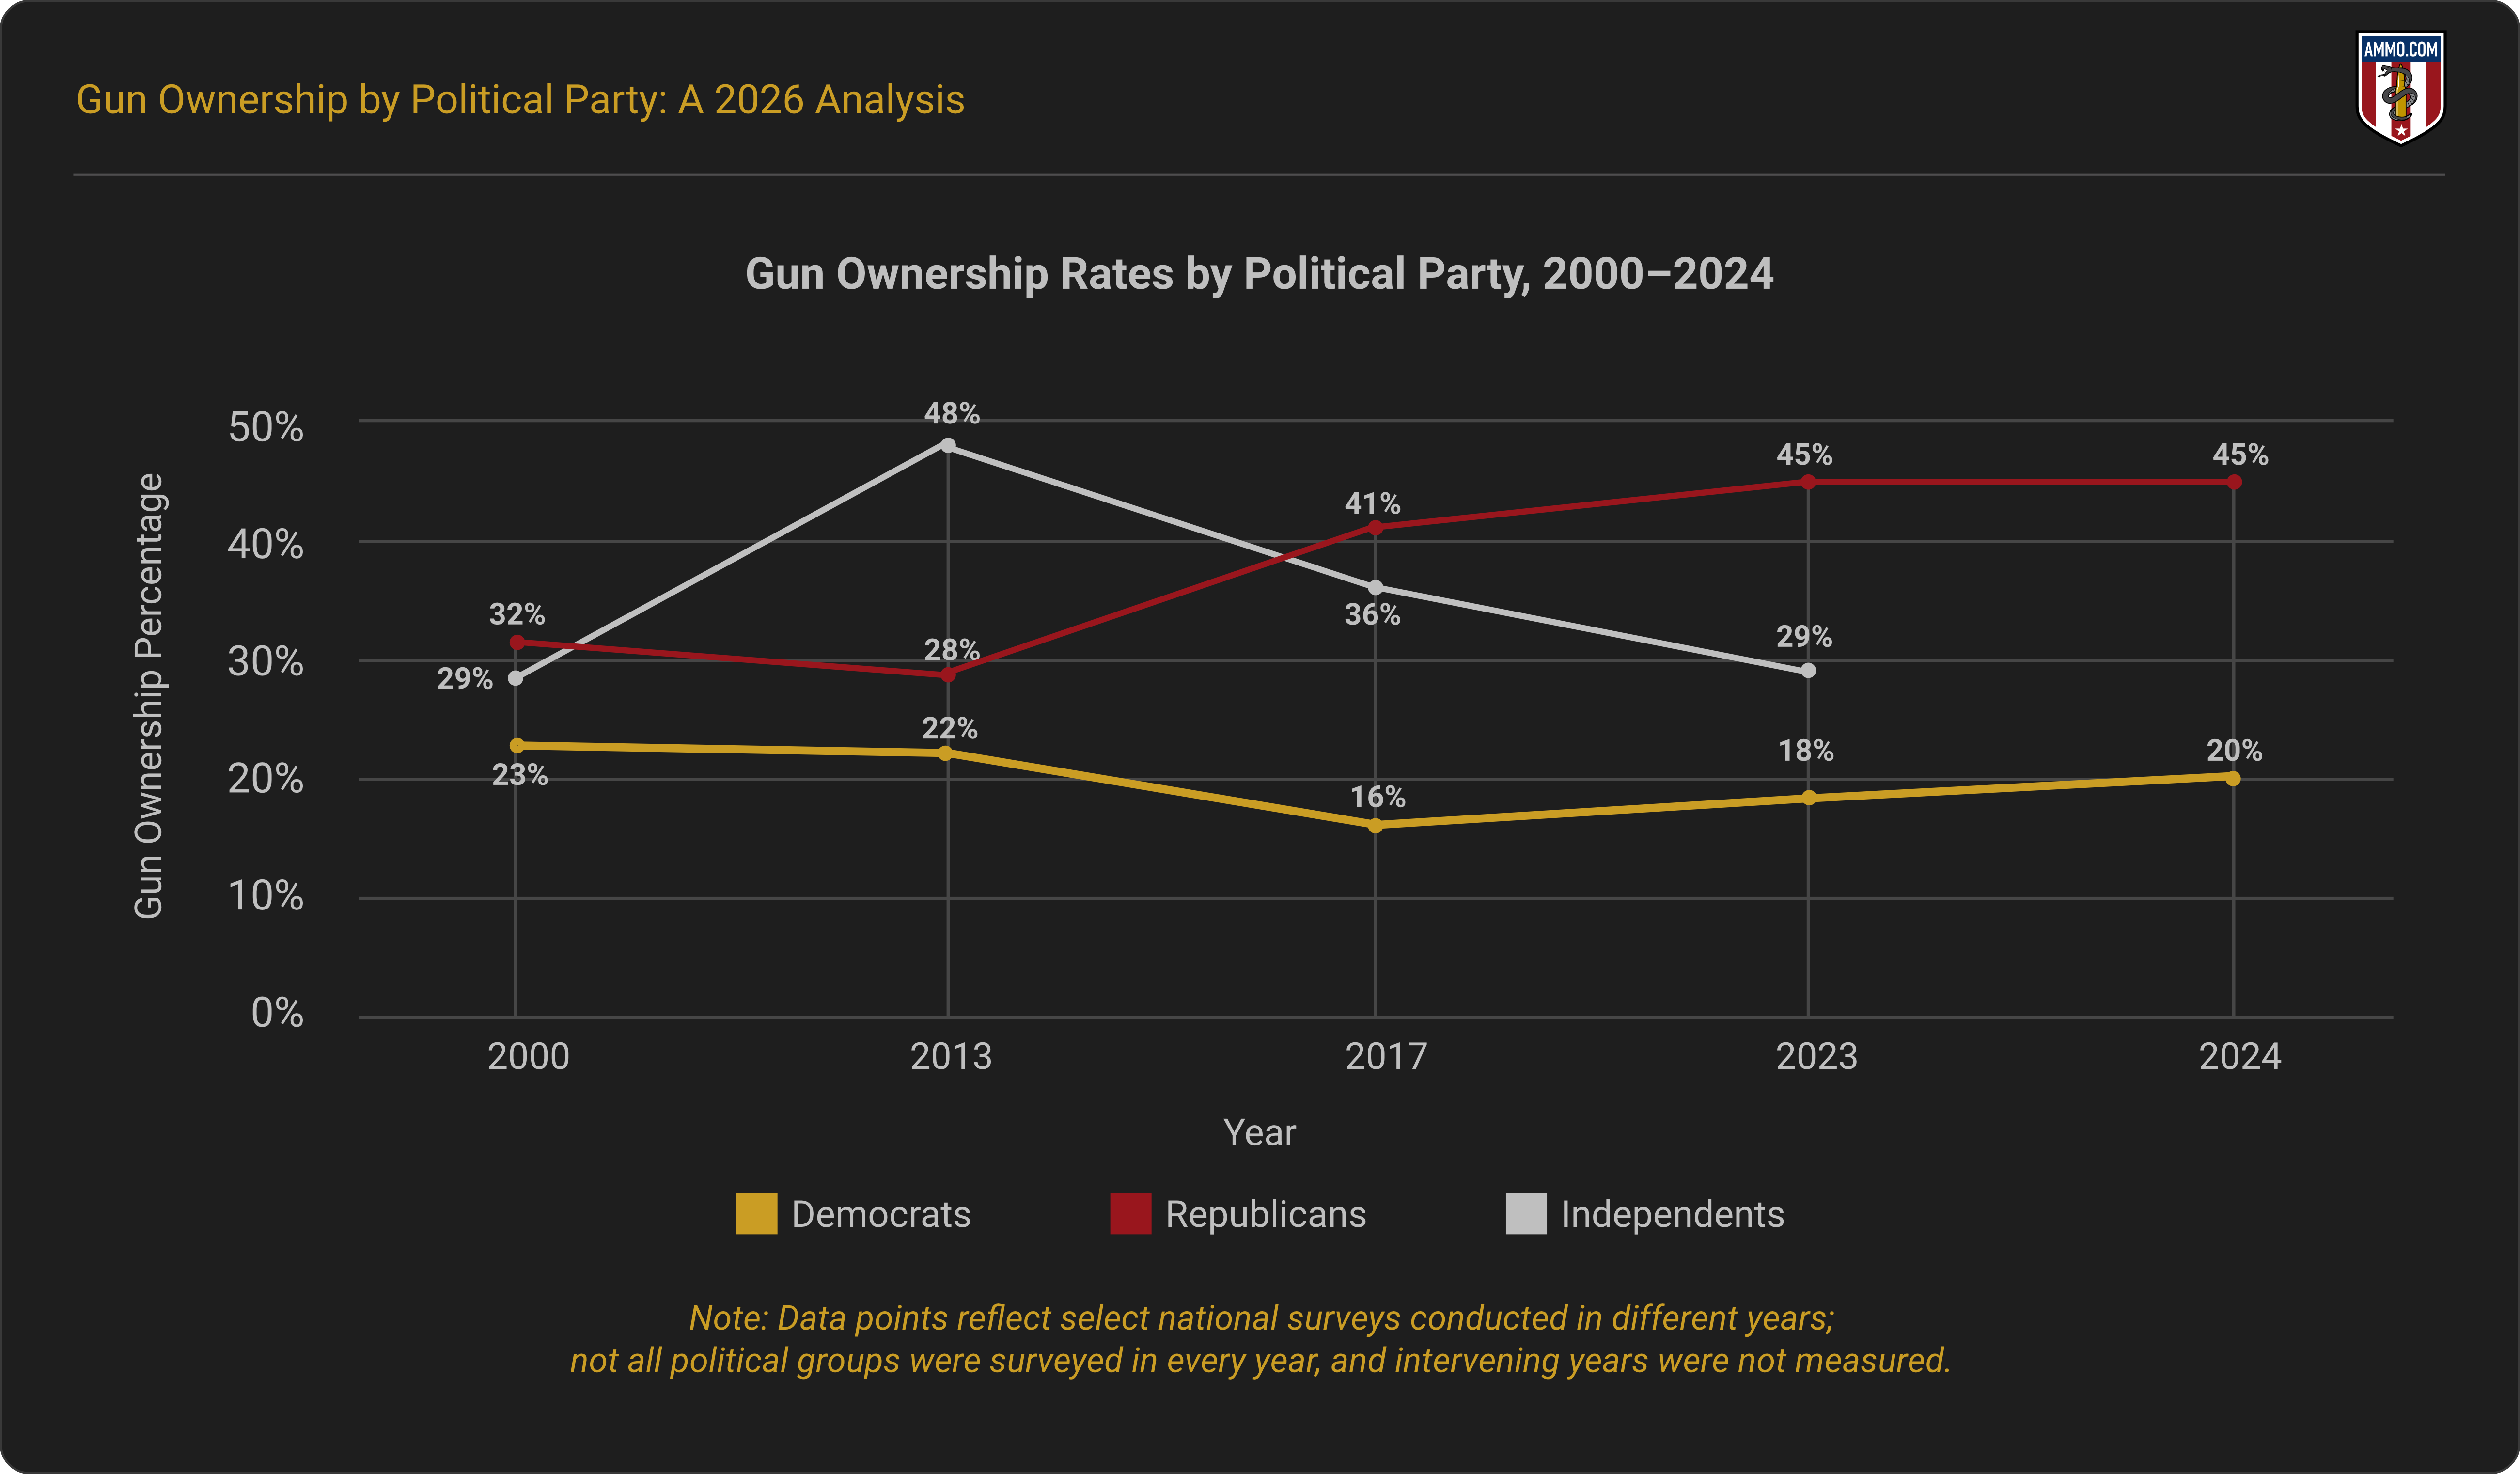
The poll shows a huge increase in gun ownership by independents between 2000 and 2013, followed by over half that increase disappearing by 2017. The poll also surveyed 41% Republican gunowners in 2017, but only 28% in 2013. Likewise, responding Democrats dropped from 22 percent gunowners in 2013 to 16% in 2017.
Polls are presented as a snapshot in time, and not explained. Still, gun ownership is an easier to quantify than beliefs – simply enough, six percent of Democrat gunowners selling off their guns during Obama’s last four years would have made a serious economic ripple. It didn’t.
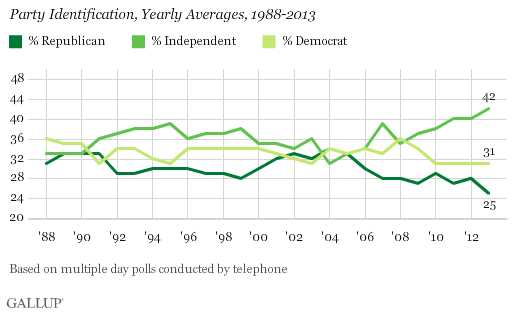
The chart shows something different than the headlines. In 2013, 42% of Americans identified as Independents, with Republicans down to 25% – the highest percentage of Independents and the lowest percentage of Republicans in Gallup’s history. See the next chart to confirm how party identification had changed over time.
The problem shown on the first chart is basically the headline – the sampling is probably correct. By introducing time into the graph (and I don’t see how they pollsters could have left it out) they got results that show the political identification of gunowners over time. I might be able to infer that, over the early Obama years, gun ownership had a correlation with maintaining a Republican identification, and that the riots of 2016 moved gunowners from Democrat to Independent and from Independent to Republican – but that’s pushing a trend line further than I like (I lack adequate data – I could hypothesize, but without the data to test the hypothesis, it is an idle thought experiment).
I’m not questioning the polling – but I am showing how to look at the reported results and decide what issue was actually being polled.

Leave a comment