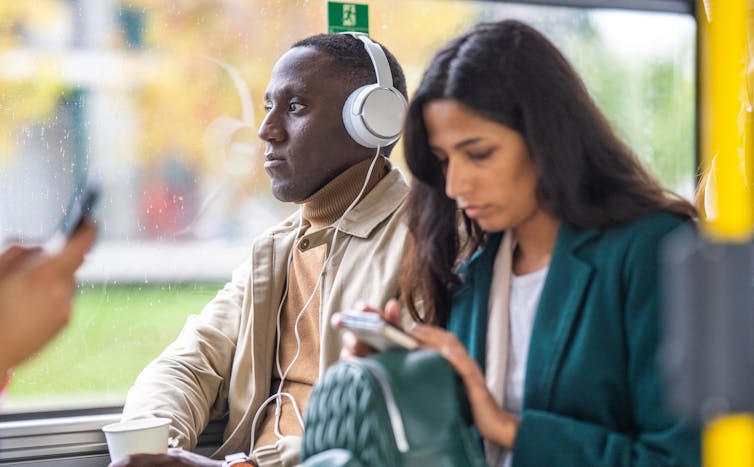
Trego's Mountain Ear

"Serving North Lincoln County"

Author: Sam

  • America is becoming a nation of homebodies

    The COVID-19 pandemic merely accelerated a trend that began in 2003. C.P. George/ClassicStock via Getty Images

    Brian D. Taylor, University of California, Los Angeles; Eric Morris, Clemson University, and Sam Speroni, University of California, Los Angeles

    In his February 2025 cover story for The Atlantic, journalist Derek Thompson dubbed our current era “the anti-social century.”

    He isn’t wrong. According to our recent research, the U.S. is becoming a nation of homebodies.

    Using data from the American Time Use Survey, we studied how people in the U.S. spent their time before, during and after the pandemic.

    The COVID-19 pandemic did spur more Americans to stay home. But this trend didn’t start or end with the pandemic. We found that Americans were already spending more and more time at home and less and less time engaged in activities away from home stretching all the way back to at least 2003.

    And if you thought the end of lockdowns and the spread of vaccines led to a revival of partying and playing sports and dining out, you would be mistaken. The pandemic, it turns out, mostly accelerated ongoing trends.

    All of this has major implications for traffic, public transit, real estate, the workplace, socializing and mental health.

    Life inside

    The trend of staying home is not new.

    There was a steady decline in out-of-home activities in the two decades leading up to the pandemic.

    Compared with 2003, Americans in 2019 spent nearly 30 minutes less per day on out-of-home activities and eight fewer minutes a day traveling. There could be any number of reasons for this shift, but advances in technology, whether it’s smartphones, streaming services or social media, are likely culprits. You can video chat with a friend rather than meeting them for coffee; order groceries through an app instead of venturing to the supermarket; and stream a movie instead of seeing it in a theater.

    Of course, there was a sharp decline in out-of-home activities during the pandemic, which dramatically accelerated many of these stay-at-home trends.

    Outside of travel, time spent on out-of-home activities fell by over an hour per day, on average, from 332 minutes in 2019 to 271 minutes in 2021. Travel, excluding air travel, fell from 69 to 54 minutes per day over the same period.

    But even after the pandemic lockdowns were lifted, out-of-home activities and travel through 2023 remained substantially depressed, far below 2019 levels. There was a dramatic increase in remote work, online shopping, time spent using digital entertainment, such as streaming and gaming, and even time spent sleeping.

    Time spent outside of the home has rebounded since the pandemic, but only slightly. There was hardly any recovery of out-of-home activities from 2022 to 2023, meaning 2023 out-of-home activities and travel were still far below 2019 levels. On the whole, Americans are spending nearly 1.5 hours less outside their homes in 2023 than they did in 2003.

    While hours worked from home in 2022 were less than half of what they were in 2021, they’re still about five times what they were ahead of the pandemic. Despite this, only about one-quarter of the overall travel time reduction is due to less commuting. The rest reflects other kinds of travel, for activities such as shopping and socializing.

    Ripple effects

    This shift has already had consequences.

    With Americans spending more time working, playing and shopping from home, demand for office and retail space has fallen. While there have been some calls by major employers for workers to spend more time in the office, research suggests that working from home in the U.S. held steady between early 2023 and early 2025 at about 25% of paid work days. As a result, surplus office space may need to be repurposed as housing and for other uses.

    There are advantages to working and playing at home, such as avoiding travel stress and expenses. But it has also boosted demand for extra space in apartments and houses, as people spend more time under their own roof. It has changed travel during the traditional morning – and, especially, afternoon – peak periods, spreading traffic more evenly throughout the day but contributing to significant public transit ridership losses. Meanwhile, more package and food delivery drivers are competing with parked cars and bus and bike lanes for curb space.

    Perhaps most importantly, spending less time out and about in the world has sobering implications for Americans well beyond real estate and transportation systems.

    Research we’re currently conducting suggests that more time spent at home has dovetailed with more time spent alone. Suffice it to say, this makes loneliness, which stems from a lack of meaningful connections, a more common occurrence. Loneliness and social isolation are associated with increased risk for early mortality.

    Because hunkering down appears to be the new norm, we think it’s all the more important for policymakers and everyday people to find ways to cultivate connections and community in the shrinking time they do spend outside of the home.

    Brian D. Taylor, Professor of Urban Planning and Public Policy, University of California, Los Angeles; Eric Morris, Professor of City and Regional Planning, Clemson University, and Sam Speroni, PhD Student in Urban Planning, University of California, Los Angeles

    This article is republished from The Conversation under a Creative Commons license. Read the original article.

  • A Closer Look at School Transportation

    First, an explanation: What is the school transportation fund used for?

    While we could go read through MT Code Annotated, the faster way to find this information is the school accounting manual (link to pdf download). Since that’s over 400 pages- I’m going to provide the relevant excerpt.

    TRANSPORTATION FUND – Authorized by Section 20-10-143, MCA, for the purpose of financing the maintenance and operation of district owned school buses, contracts with private carriers for school bus service, individual transportation contracts, and any amount necessary for the purchase, rental, or insurance of yellow school buses or operation of the transportation program. The fund may be used only to support costs of
    home-to-school transportation.

    So, in brief: The school transportation is only for transporting students between home and school. It can pay for the fuel, the insurance, the maintenance, and the bus driver.

    We’ve been comparing local elementary districts, and we’ll continue to do so. If you’ve been downloading the school budgets, you’ll find these about 8 pages into the files.

    Transportation Funding for 24/25 School Year

    Funding SourceTregoFortineOlney-Bissell
    County Reimbursement$12,353.21$15,378.66$27,017.92
    State Reimbursement$18,311.04$15,378.66$27,017.92
    District Levy0.0$69,242.68$158,308.00
    Total:$40,000$100,000$212,343.85

    First obvious question: Why are the reimbursement rates not the same for Trego? Because Trego was able to offset them by lowering the budget. It probably didn’t lower your personal taxes all that much, since that savings was distributed across the county, but it had some impact.

    Next, since it’s fairly obvious that Trego, with no local levy, is a bit of an anomaly, we’ll look at Trego Elementary over time.

    Funding Source21/2222/2323/2424/25
    County $17,873.06$17,960.04$18,311.04$12,353.21
    State $17,873.07$17,960.04$18,311.04$18,311.04
    District$13,253.87$13,079.92$5,657.35$0.0
    Total:$49,000.00$49,000.00$49,000.00$40,000.00

    Trego’s evidently dropped an already small levy over the past two years. The reimbursement received from the county is disproportionately large, when compared to the other two schools. This doesn’t necessarily mean something’s been calculated/reported incorrectly, but it raises the possibility and suggests a closer look at how that reimbursement is calculated is probably merited.

    As a component of the whole transportation budget, Fortine receives 30% from the state/county. Olney-Bissell? 25% And for Trego?

    Percent of Transportation Budget Coming From State/County Reimbursement by Year for Trego Elementary

    Year21/2222/2323/2424/25
    Percentage72.9573.3088.45100

    Weirdly high, even several years ago. Nice for the local tax payer, but odd enough to warrant a closer look. An additional puzzle: Is it common for school districts to have the same transportation budget from year to year? I don’t know- but we can certainly take a closer look at Fortine and Olney-Bissell. More on transportation next week!

    A reminder: We’re looking more closely at transportation, because transportation is the major levy difference between Trego Elementary and its two adjacent elementary districts.

  • AI-generated images can exploit how your mind works − here’s why they fool you and how to spot them

    A beautiful kitchen to scroll past – but check out the clock. Tiny Homes via Facebook

    Arryn Robbins, University of Richmond

    I’m more of a scroller than a poster on social media. Like many people, I wind down at the end of the day with a scroll binge, taking in videos of Italian grandmothers making pasta or baby pygmy hippos frolicking.

    For a while, my feed was filled with immaculately designed tiny homes, fueling my desire for minimalist paradise. Then, I started seeing AI-generated images; many contained obvious errors such as staircases to nowhere or sinks within sinks. Yet, commenters rarely pointed them out, instead admiring the aesthetic.

    These images were clearly AI-generated and didn’t depict reality. Did people just not notice? Not care?

    As a cognitive psychologist, I’d guess “yes” and “yes.” My expertise is in how people process and use visual information. I primarily investigate how people look for objects and information visually, from the mundane searches of daily life, such as trying to find a dropped earring, to more critical searches, like those conducted by radiologists or search-and-rescue teams.

    With my understanding of how people process images and notice − or don’t notice − detail, it’s not surprising to me that people aren’t tuning in to the fact that many images are AI-generated.

    We’ve been here before

    The struggle to detect AI-generated images mirrors past detection challenges such as spotting photoshopped images or computer-generated images in movies.

    But there’s a key difference: Photo editing and CGI require intentional design by artists, while AI images are generated by algorithms trained on datasets, often without human oversight. The lack of oversight can lead to imperfections or inconsistencies that can feel unnatural, such as the unrealistic physics or lack of consistency between frames that characterize what’s sometimes called “AI slop.”

    Despite these differences, studies show people struggle to distinguish real images from synthetic ones, regardless of origin. Even when explicitly asked to identify images as real, synthetic or AI-generated, accuracy hovers near the level of chance, meaning people did only a little better than if they’d just guessed.

    In everyday interactions, where you aren’t actively scrutinizing images, your ability to detect synthetic content might even be weaker.

    Attention shapes what you see, what you miss

    Spotting errors in AI images requires noticing small details, but the human visual system isn’t wired for that when you’re casually scrolling. Instead, while online, people take in the gist of what they’re viewing and can overlook subtle inconsistencies.

    Visual attention operates like a zoom lens: You scan broadly to get an overview of your environment or phone screen, but fine details require focused effort. Human perceptual systems evolved to quickly assess environments for any threats to survival, with sensitivity to sudden changes − such as a quick-moving predator − sacrificing precision for speed of detection.

    This speed-accuracy trade-off allows for rapid, efficient processing, which helped early humans survive in natural settings. But it’s a mismatch with modern tasks such as scrolling through devices, where small mistakes or unusual details in AI-generated images can easily go unnoticed.

    People also miss things they aren’t actively paying attention to or looking for. Psychologists call this inattentional blindness: Focusing on one task causes you to overlook other details, even obvious ones. In the famous invisible gorilla study, participants asked to count basketball passes in a video failed to notice someone in a gorilla suit walking through the middle of the scene.

    If you’re counting how many passes the people in white make, do you even notice someone walk through in a gorilla suit?

    Similarly, when your focus is on the broader content of an AI image, such as a cozy tiny home, you’re less likely to notice subtle distortions. In a way, the sixth finger in an AI image is today’s invisible gorilla − hiding in plain sight because you’re not looking for it.

    Efficiency over accuracy in thinking

    Our cognitive limitations go beyond visual perception. Human thinking uses two types of processing: fast, intuitive thinking based on mental shortcuts, and slower, analytical thinking that requires effort. When scrolling, our fast system likely dominates, leading us to accept images at face value.

    Adding to this issue is the tendency to seek information that confirms your beliefs or reject information that goes against them. This means AI-generated images are more likely to slip by you when they align with your expectations or worldviews. If an AI-generated image of a basketball player making an impossible shot jibes with a fan’s excitement, they might accept it, even if something feels exaggerated.

    While not a big deal for tiny home aesthetics, these issues become concerning when AI-generated images may be used to influence public opinion. For example, research shows that people tend to assume images are relevant to accompanying text. Even when the images provide no actual evidence, they make people more likely to accept the text’s claims as true.

    Misleading real or generated images can make false claims seem more believable and even cause people to misremember real events. AI-generated images have the power to shape opinions and spread misinformation in ways that are difficult to counter.

    Beating the machine

    While AI gets better at detecting AI, humans need tools to do the same. Here’s how:

    1. Trust your gut. If something feels off, it probably is. Your brain expertly recognizes objects and faces, even under varying conditions. Perhaps you’ve experienced what psychologists call the uncanny valley and felt unease with certain humanoid faces. This experience shows people can detect anomalies, even when they can’t fully explain what’s wrong.
    2. Scan for clues. AI struggles with certain elements: hands, text, reflections, lighting inconsistencies and unnatural textures. If an image seems suspicious, take a closer look.
    3. Think critically. Sometimes, AI generates photorealistic images with impossible scenarios. If you see a political figure casually surprising baristas or a celebrity eating concrete, ask yourself: Does this make sense? If not, it’s probably fake.
    4. Check the source. Is the poster a real person? Reverse image search can help trace a picture’s origin. If the metadata is missing, it might be generated by AI.

    AI-generated images are becoming harder to spot. During scrolling, the brain processes visuals quickly, not critically, making it easy to miss details that reveal a fake. As technology advances, slow down, look closer and think critically.

    Arryn Robbins, Assistant Professor of Psychology, University of Richmond

    This article is republished from The Conversation under a Creative Commons license. Read the original article.

  • Why do the Levies Differ?

    Last week, we looked at a financial comparison between Trego, Fortine, and Olney-Bissell Elementary Districts, and noted the following differences in Levy amounts:

    • Fortine: 73.5
    • Olney-Bissell: 81.41
    • Trego: 48.64

    With Trego substantially lower than the other two, the obvious question is: Why?

    Our first point is to compare the levied funds for all three schools- again, using the 24/25 budgets, since we won’t have 25/26 budgets until this fall.

    FundTregoFortineOlney-Bissell
    General38.2836.9539.34
    Transportation0.026.1327.0
    Bus Depreciation8.287.530.00
    Tuition0.00.002.63
    Technology0.00.01.53
    Building Reserve2.082.8910.91

    There are a few things to notice here: All three schools levy fairly comparatively in their general funds. Trego and Fortine have comparable bus depreciation funds, but Olney-Bissell isn’t levying in that fund at all. Meanwhile, Trego didn’t levy in the transportation fund? Olney-Bissell levied tuition and technology when neither Trego or Fortine did, and their building reserve levy is considerably higher.

    The next obvious question then: Why would a district NOT levy in a fund? There are a few potential reasons: First, it might not be a fund they can levy in without a vote. Two: The board of trustees might decide not to. Which of these funds have permissive levies? Transportation, Bus Depreciation, Tuition, and Building Reserve.

    The first question our table brings up, Why didn’t Trego have a transportation levy? I can answer, because as the district clerk that set up the budget for the school board, I was involved in suggesting that course of action to the board of trustees.

    Trego’s transportation budget was lowered, compared to the previous year, because it appeared there was a significant amount of it that wasn’t being spent from year to year. This extra “unreserved fund balance reappropriated” went against what would otherwise have been levied, reducing the cost to local taxpayers. The county treasurer initially thought I’d made an error.

    The next question, I’ll have to speculate on. The Bus Depreciation Fund is not depreciation, per say, for anyone who uses the word in an actual accounting sense. Think of it as a savings account for the purpose of replacing school buses. There are rules about how much can be levied in this fund in any year, and the board of trustees can levy anywhere between all and none of the amount. In the case of Olney-Bissell, their allowed amount might be zero, or their board might have decided not to raise funds for school bus replacement that year in order to keep taxes lower.

    Next two questions: Why did Olney-Bissell levy in tuition and technology funds? Because it could, and because it needed to in the case of the tuition fund. Levies in the tuition fund were, prior to changes in tax law, for only really specific circumstances. As for the technology fund? There’s no permissive levy there: the taxpayers voted for that one.

    Final question: Why is the building reserve levy so much higher in Olney-Bissell? From the small, comparative numbers, it looks like Fortine and Trego levy only the precise amount to maximize the amount of money provided by the state for the fund. For example: Trego raised a bit over $5,000 from local taxes, but got about $12,500 from the state as a result. As for Olney-Bissell? They’ve also got voted levies funding their building reserve, in addition to the permissive levy (2.21 mills).

    What can we conclude? In terms of levies that the public doesn’t get to vote on, the schools are fairly comparable, with the exception of Trego’s transportation levy. Since we know why that happened- let’s look at the previous budgets (23/24), and see how those compared.

    Looking just at transportation:

    Fund (23/24)TregoFortineOlney-Bissell
    Transportation2.1928.1822.32

    Trego’s transportation levy was still weirdly low. What about 22/23?

    Fund (22/23)TregoFortineOlney-Bissel
    Transportation6.4437.037.84

    By this point, it’s become apparent that the major difference in the levies between Trego and Fortine is predominantly caused by differences in the transportation budget. The obvious question: What is causing this difference? Next week- a closer look at elementary transportation budgets.

    And, finally, a reminder: This information is public. And more than that, it’s readily available online. You can find all of these budgets and download them readily. Here’s your link. The information is available by district and year. Almost everything I’ve referenced in this article can be found within the first two pages.

  • What would the Trego taxes look like, at Fortine Levy rates?

    The easiest way to answer “how would merging the districts impact local taxes?” is to compare the overall levy rates between the two districts, and their impact on school taxes, depending on property value. We’ll neglect tuition, since it’s not clear what those values are going to be, or if the law will change.

    FundTregoFortine
    General38.2836.95
    Transportation0.026.13
    Bus Depreciation8.287.53
    Tuition0.00.00
    Technology0.00.0
    Building Reserve2.082.89
    Total48.6473.50

    This means that switching from Trego to Fortine would be an increase of 24.86. This has a sizeable impact on taxation.

    House Value$100,000$300,000$600,000
    Tax Increase$33.56$100.68$201.37

    This is a “worst case” scenario, to some extent. It assumes that adding Trego’s taxable value to Fortine’s wouldn’t make it possible to lower the levies somewhat (if not to Trego’s level). It likely would do so, though the decision to lower them would have to be made at a school board level, not by the taxpayers more broadly.

    At any rate, the difference in taxable values between the districts mean that while a mill is calculated similarly for tax impact, it’s not calculated similarly for income to the school (this is where the difference in taxable valuation of the district comes in). So the next relevant question is: What would a merger do for the income to the school district? More on that in a later week.

  • Trips to the playground and jigsaw puzzles: five surprising ways to help children learn to write

    Rachaphak/Shutterstock

    Sinéad McCauley Lambe, Dublin City University

    It’s a milestone that leaves parents beaming with pride: the first time their child shakily writes out their own name. And it’s the start of many more key childhood moments, from Christmas lists to writing their own stories.

    If you’re keen to help your child learn to write, you might think about asking them to try to copy shapes, or trace over the dotted outline of a letter. But there’s a lot more that goes into writing. It requires fine motor skills using the hands – and this can be practised through threading beads, rolling playdough and stacking blocks.

    However, while fine motor skills play a central role in getting children ready to write, it doesn’t end there. Handwriting is a complex developmental process, and preparation for handwriting also involves the development of key gross motor skills, as well as visual-perceptual skills.

    I’m a researcher who works on how children learn to write. Below are five ways to help your child to prepare for handwriting that you might not have considered.

    Take them to the playground

    It might not seem that obvious, but a trip to the playground is perfect preparation for handwriting. All that open space and climbing equipment provide ample opportunities for young children to develop their gross motor skills.

    Gross motor skills involve the body’s large muscles and are needed for balance and stability as well as posture and coordination. Think monkey bars – a fantastic and fun way to develop shoulder stability which allows for greater control of the small motor movements of the hands and fingers.

    Another important element of gross motor skills is what’s known as crossing the midline. The midline is an imaginary line that runs down the centre of a child’s body. It plays a central role when developing hand dominance as children learn to reach across their bodies to write. Can your child hang from the monkey bars with their hands crossed? That’s great practice in crossing the midline.

    And all that open space, interspersed with bulky and busy playground equipment, provides the ideal opportunity for children to develop spatial awareness as they duck and dive, swerving to avoid oncoming obstacles. Spatial awareness plays a key role in letter formation, placement and size, as well as spacing and page alignment.

    Lots of blank space

    Through early mark making and scribbling, children explore a range of movements and shapes. This early stage of mark making is essential in laying the foundations for handwriting development as the child develops a growing awareness of space and their place within it.

    Toddlers drawing on pavement with chalk
    Give children space for mark making. AnikaNes/Shutterstock

    Look for large blank spaces in and outside of your home that children can use for mark making and drawing. Forget colouring books, and instead think large sticks of chalk on big open pavements, rolls of paper across open floor space, or large sheets of blank paper on an easel.

    Teach them how to look carefully

    Think about asking a young child to copy a shape, or a letter using their pencil. “Just copy the shape” – it’s simple, isn’t it?

    The problem is, it’s not simple. At all.

    It begins with visual perception – the process whereby the brain extracts and organises information, giving meaning to what we see. This makes a collection of lines into a square, for instance. Visual-motor integration is the ability to be able to coordinate fine motor skills and visual-perceptual skills to produce that letter, shape or number in a legible manner.

    The visual component enables children to discriminate between letter shapes to recognise each letter’s specific characteristics, and to identify their orientation. The motor element allows the child to carry out the necessary sequence of movements to form the letter.

    By exposing young children to lots of opportunities to develop their visual-perceptual skills, you can help to prepare them for handwriting. Think richly illustrated picture books, jigsaw puzzles and Where’s Wally books – these help children sort out the meaning in marks and shapes. Picking out shapes, numbers and letters on the street as you walk to the shop together is a good opportunity, too.

    Shapes before letters

    It might be tempting to pick up a colourful ABC practice book with a neat “wipe clean” whiteboard feature to help your child learn to write. But hold off putting it in your shopping basket for now. Before children are ready to write letters formally, they should first be able to copy nine geometric shapes.

    Nine geometric shapes
    Pre-writing shapes. The Conversation

    The ability to copy geometric forms is recognised in research as an indication of writing readiness in a young child. Formal handwriting training should be delayed until a child can successfully copy a vertical line, a horizontal line, a cross, a circle, a right oblique line, a square, a left oblique line, an oblique cross and a triangle.

    Ditch the broken crayons

    There are few things more frustrating for a young child than fading markers, blunt colouring pencils or a box of broken and bruised crayons. My research has found that the quality of writing materials matters when it comes to motivating the reluctant writer to give it a go.

    Providing children with a variety of novel and fun writing materials leads to increased motivation and enjoyment of writing. These could be brightly coloured felt pens, gel pens, highlighters, magic markers and even scented markers and pencils, and don’t forget the finger paints. The messier the better.

    Sinéad McCauley Lambe, Assistant Professor, School of Inclusive and Special Education, Dublin City University

    This article is republished from The Conversation under a Creative Commons license. Read the original article.