Trego's Mountain Ear

"Serving North Lincoln County"

Category: Demography

  • Wells-Barnett Becoming Barbie

    Wells-Barnett Becoming Barbie

    I note that Mattel is making a Barbie doll that honors Ida Wells-Barnett.

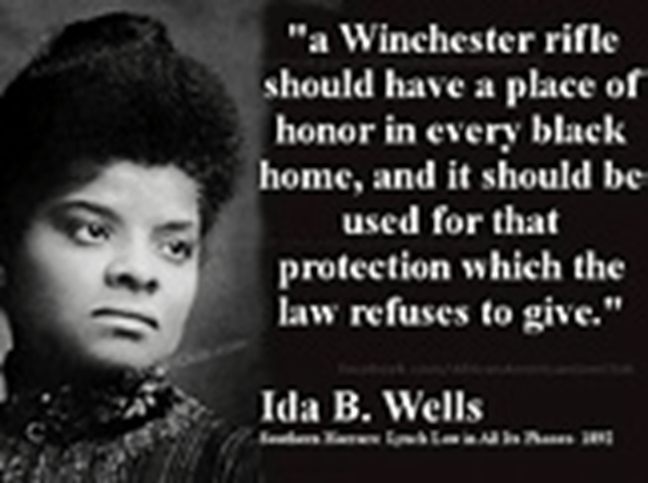
    They note that she was a journalist, suffragette, and had a role in founding the NAACP – to me, her unusual strength was the use of statistics in her research on lynchings.  She deserves mention in her early role in social research and reliance on statistics.  Still, the article doesn’t include the quote that I find easy to remember:

    I’m a Montanan.  My state’s legal tradition begins with vigilantes hanging a crooked sheriff and his minions.  In 1884, Granville Stuart organized another vigilance committee – now known as Stuart’s Stranglers – to end rustling.  In a short time, Stuart’s Stranglers killed at least 20 rustlers, and numbers up to 100 are written in some accounts.  By the end of the Summer, Granville Stuart was president of the Stockman’s Association.  Stuart’s activities, despite the poor record keeping, made 1884 the highest year for lynching white men in the US. (My readings suggest that the first recorded use of the numbers 3-7-77 was by Stuart’s Stranglers and not by the Vigilantes of Montana 20 years earlier)

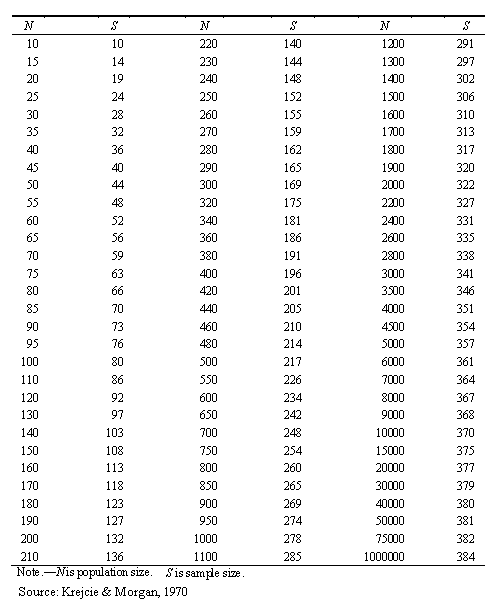
    Douglas Linder has published the data series Ida Wells started (maintained at Tuskegee) on lynchings by state and race. Clicking the link will give you an idea of how solid the lady’s research was – and how racist it was in some areas.

    I’ll be looking for the Barbie – but I want mine to be holding a lever action Winchester.  She may not have been granted a graduate degree – but her work was important in developing American Sociology.

  • Our Communities by ACS Numbers

    I listened to a comment about the median household income in Trego – and defaulted to my professional statement before retirement – “That’s American Community Survey data, and it’s not very good for small communities.”  When I checked it, the $36,458 median household income for Trego translates as “somewhere between $27,478 and $45,438.  ACS data has its uses, but it has to be used with a lot of caution.

    So here’s a little ACS data on our communities – you can check for margin of error (MOE) here.   I wouldn’t recommend using any of the numbers without reviewing MOE – but just sharing the data shows the variance.  It’s safe to admit that my household was one selected for the ACS. With two retirees at home, I didn’t hurt Trego’s school enrollment rate, I raised the percentage of bachelors degree or above, kept the employment rate down, and raised the median age.

    Trego CDPFortine CDPEureka CCDRexford Town
    Population5153176,47078
    Median Age60.527.950.153.3
    Median Household Income$36,458$68,036$40,827$30,481
    Bachelor’s Degree or more26.10%19.20%22.40%0.00%
    Veterans6.80%16.20%12.90%16.80%
    Poverty9.50%5.20%20.40%23.60%
    School Enrollment97.80%72.30%81.90%100%
    Employment Rate40.20%59.50%38.30%20.60%
    Housing Units2831773,71673
    Occupied Housing Units2371442,79646
    Disabilities31.10%18.80%26.70%65.90%
    Children under 189.30%32.50%22.10%13%

    It looks like the Fortine sample drew some younger respondents.  Eureka CCD with a larger population and larger sample is probably closer to correct, and the town of Rexford data is probably close to useless because the small sample size almost guarantees sampling bias

  • Trego and the American Community Survey

    Montana’s American Community Survey is composed from the final interviews conducted with 10,138 households in the state.  Since Montana has 519,935 households, the chance of any household being in the final interview is 10,138 out of 519,935 = 0.0195, right around 2% of the population is included in the survey.  Since Tregp shows 295 households, we can guess that our community data is assembled from somewhere around 6 completed interviews.

    This table about sample sizes is from kenpro.org

    As you will note, a population of 250 calls for 152 samples, and that the break is in the lower right corner – while a sample of 382 covers a population of 75,000, 384 is good for a million.  I’m not going into details about sampling – this is a blog, not a stats class. If enough people ask for the stats instruction, I’ll do another article.  Suffice to say, we can expect the numbers on the ACS to be pretty vague in small communities. So let’s look at the ACS data: data.census.gov

    The top of the page shows:

    Total Population                                           515

    Median Household Income                          $36,458

    Bachelor’s Degree or Higher                       26.1%

    Employment Rate                                        40.2%

    Total Housing Units                                      283

    Without Health Care Coverage                   9.0%

    Total Households                                         249

    As we go further down the page, we start to encounter the variance – the range the number represents.  That 515 population is taken from the decennial census not the ACS. 

    Median Age:    60.5 +/- 3.2 years 

    16.8% of Trego folks speak a language other than English at home – plus or minus 15.4% so that’s somewhere between 6 and 166.  Probably not a particularly useful piece of information.

    That Median Household Income turns out to be plus or minus $8,980: the number can be as much as 24.6% off either way.  It can be as low as $27,478 or as high as $45,438.  As we move into the full chart on that number, we see that the number of households lists the margin of error as plus or minus 67.  Could be as low as 182 or as high as 316. 

    That 26.1% of Trego residents with a bachelor’s degree or more has a 12% margin of error – it could be as low as 14.1% or as high as 38.1%,  It shows 8.1% of our residents holding graduate or professional degrees, but doesn’t give a margin of error there.

    The school board will be pleased to know that 97.8% (plus or minus 6.6%) of our kids are enrolled in Kindergarten to 12th grade.  Might even surprise the County Superintendent.  Pretty sure some kids out there are home-schooled.

    That 40.2% employment rate (+/- 12.9%) looks low – but I guess it fits right in with a median age over 60 and 31.1% (+/-9.4%) disability. 

    And finally, there are 48 women 15 to 50 years old – but the margin of error is 38, so it translates to somewhere between 10 and 86.

    The ACS data is good – but the sample for Trego was small, and not checking the limitations lets us make blunders.

  • 4% Growth for County 57

    The 2020 Census numbers have been released, and we’re looking at data we can begin to use.  I’m hoping to get the data at a school district level later on – but for now, we have county level data, CCD level data, and Census tract level data.

    First – Lincoln County’s population dropped by a tenth of a percent.  Second, the population in the Libby CCD dropped by 1.2% (now 9,772), population in the Troy CCD dropped by 3.9% now 3,435), and population in the Eureka CCD increased by 4.0% (now 6,470).   North County is now officially 89 residents less than a third of the county’s population.  3,435 of the people represented by the Troy Commissioner reside in the Troy CCD, while 3,124 reside in the Libby CCD.  This is a trend worth watching.

    Housing data is available at the county level – and it may give us some insight on rentals in the area.  Housing units in Lincoln County decreased by 4.0% – occupied housing units increased by 0.5%, and unoccupied housing units decreased by 19.6%. 

    In County 57 – the Eureka CCD – housing unit numbers are:

     2020 #2020 %2010 #2010 %Change
    Total Housing Units3,716 3,771 -1.5%
    Occupied2,79675.2%2,69271.4%3.9%
    Vacant92024.8%1,07928.6%-14.7%

    All these statistics are in comparison with the 2010 Census. 

    It’s going to be fun as future releases will show even more usable data.

  • CDC Data Visualization

    CDC Data Visualization

    Raw data is nice, but can be hard to visualize.  The CDC link at the bottom provides the data, but also a variety of ways to view it in chart and graph formats.  As the saying goes, past performance does not guarantee future results – but it isn’t a bad guideline.

    https://data.cdc.gov/NCHS/AH-Provisional-COVID-19-Death-Counts-by-Age-in-Yea/3apk-4u4f
  • Measuring Migration

    When you work with Census data, migration numbers can be very precise – but the 10 years between each Census often make the data obsolete.  As demographers, we had to find ways to work around that – and U-Haul had the websites that let me better understand and explain migration.

    For example, if I price renting a 15’ truck in Bakersfield, California, heading to Eureka, Montana, I get a price quote of $5,173 today.  On the other hand, it costs $1,109 to rent the same truck in Eureka and drive it to Bakersfield.

    If I want to see beautiful Bend, Oregon in the rear view mirror of my 15’ rental truck, the website tells me the trip to Eureka, MT is $3,052.  Renting the same truck in Eureka, to go to Bend is only $654.

    I didn’t learn to abuse U-Haul’s website in a classroom – I got the general idea while riding a bus seated alongside a very successful retarded guy.  He made a living riding the bus – back then there was a pass that was good for six months travel in country – and then driving a car or small truck back to Denver.  He may not have completed high school – but he gave me the foundation of a method to quantify migration.  Obviously, Bakersfield and Bend have more people trying to leave, and Eureka has more inmigration. 

    If we look at the trip from Minneapolis to Eureka, it’s $1,703.  Eureka to Minneapolis is $1,362.  Park City, Utah showed up as $990 to Eureka, while Eureka to Park City was $495. 

    It provides a better feel for migration in central locations like Park City – where you can go in any direction.  You can’t go north from Eureka in this time of Covid – and you can’t drive west from California.  Still, it gives data in something resembling a ratio – the challenge the rental truck industry has is getting the trucks from destination locations (inmigration) back to the places they came from (outmigration) without hiring my friend with the Greyhound pass.

    TaxFoundation.org gives last year’s data, and it is massaged and compiled from more moving companies.  Guess what?  The top destination state (inmigration) is Idaho – and Idaho has a lot of similarities to western Montana.  Oregon was a destination state – and still needs the rental trucks from Eureka to keep things going.  I think the last person renting a truck to leave New Jersey might want to turn the lights off as he or she pays the last toll to drive out.

    I’ve rented U-Haul trucks a couple of times – but the company has provided me a lot of comparative data on migration during my career.  It’s still science, and it’s still numbers driven.