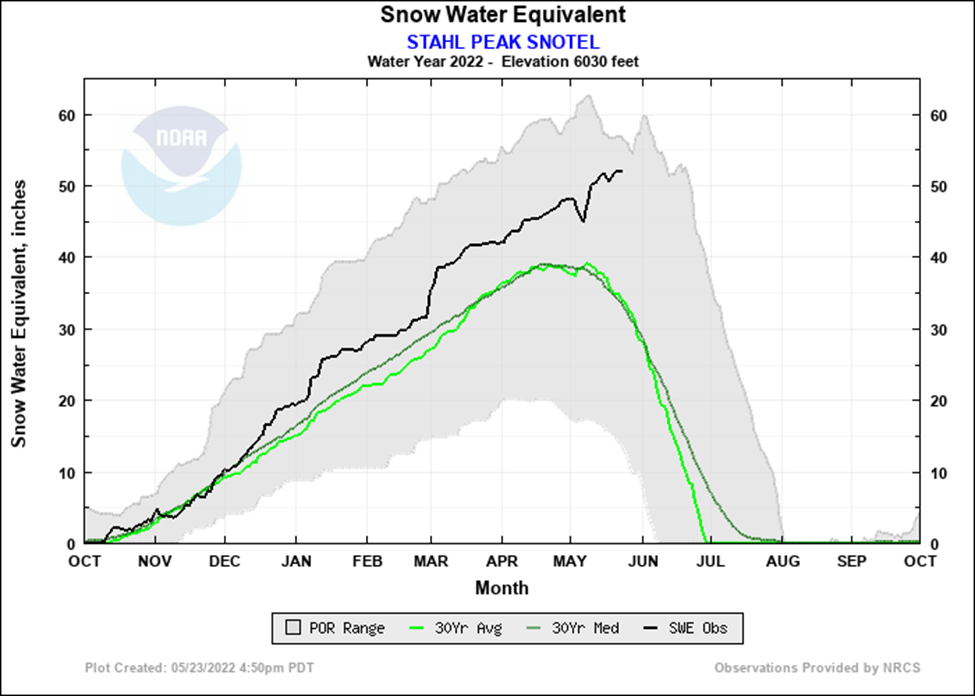
It’s the time when the snowpack can rise quickly – a cool, rainy Spring. The latest observation is 34.3 inches of water on the pillow – 151% of the 30 year average. It is definitely a lot easier to click the link than it was to haul the snow tubes up to get the data in the late seventies.
What happens next is a question for the weather forecasts. NOAA has released these projections for June, July and August.
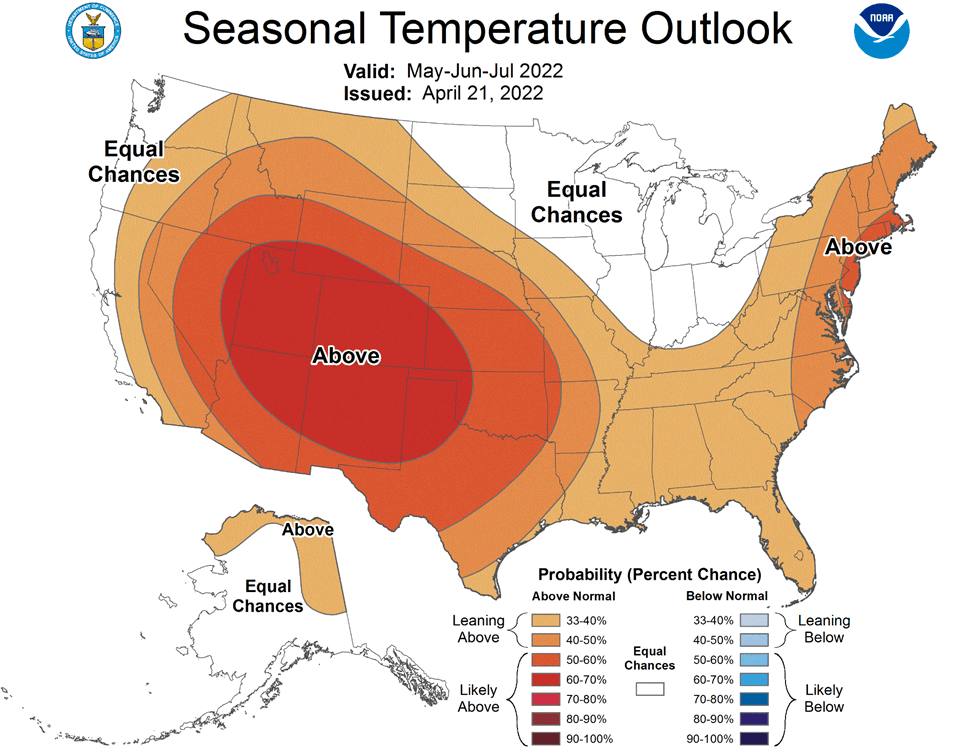
The folks who know about these things are calling for a warmer and drier summer than normal. If that’s the case, it is good to be going in with a little extra water in the high country.
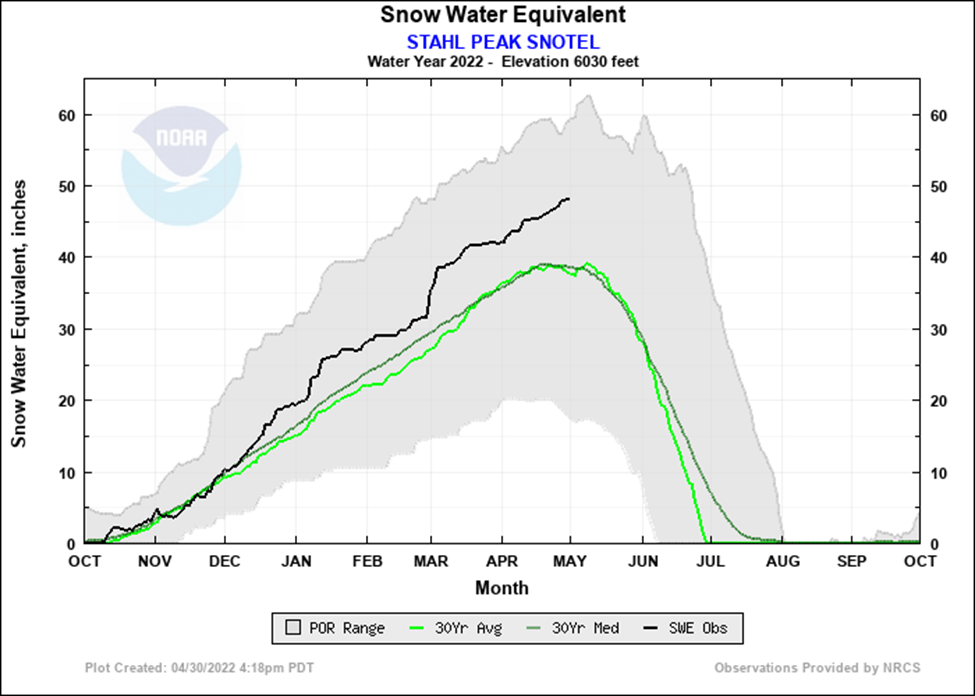
This graph, from 4-30-22 shows that the snowpack on Stahl is still increasing. The upper line on the record suggests that there’s only a week or so left for it to increase. Still, 127% of the long-term average is nice to see.
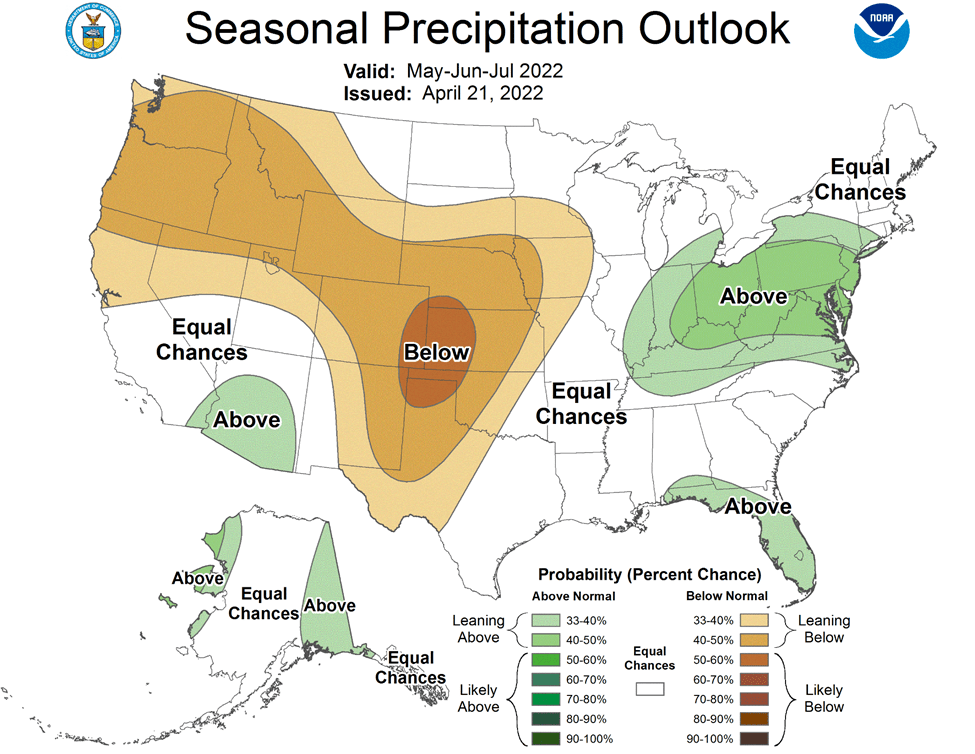
NOAA has this posted for May-June-July, suggesting we can expect the chances of warmer temperatures and less than normal precipitation coming up.
Times have changed. In the seventies, I would have been up and out this morning to snowmobile in to Weasel Divide, Stahl Peak, and Grave Creek snow courses, and worked the details out in the evening in a Libby motel room. Now, I can get the data in my kitchen by clicking a link.
So we’re going into February at 127% of average – 5 ½ inches of water more. Something interesting happened between 2:00 pm and 3:00 pm on January 27 – the snow depth reported went from 187 inches to 75 inches, while the snow water equivalent stayed the same at 27 inches. This is why we carried so many spare parts on the back of the old Ski-doo Alpines – one ski up front, two tracks behind, and a small pickup bed behind the seat. Monitoring equipment needs to be monitored.
Date
Time PST
Snow WaterEquivalent(inches)
SnowDepth(inches)
SnowDensity(%)
PrecipitationTo-Date(inches)
CurrentTemperature(degrees F)
01/28/2022
0900
26.9
187.0
14
46.1
18.0
01/28/2022
0800
26.9
187.0
14
46.1
16.9
01/28/2022
0700
26.9
187.0
14
46.2
12.4
01/28/2022
0600
26.9
187.0
14
46.1
12.4
01/28/2022
0500
26.9
187.0
14
46.1
12.9
01/28/2022
0400
26.9
187.0
14
46.1
13.1
01/28/2022
0300
26.9
187.0
14
46.2
15.4
01/28/2022
0200
26.9
187.0
14
46.2
15.1
01/28/2022
0100
26.9
187.0
14
46.2
13.3
01/28/2022
0000
26.9
75.0
36
46.2
14.5
01/27/2022
2300
26.9
187.0
14
46.2
12.7
01/27/2022
2200
26.9
75.0
36
46.2
13.5
01/27/2022
2100
26.9
76.0
35
46.2
13.6
01/27/2022
2000
26.9
76.0
35
46.2
14.0
01/27/2022
1900
26.9
76.0
35
46.2
14.2
01/27/2022
1800
26.9
76.0
35
46.2
13.8
01/27/2022
1700
27.0
76.0
36
46.2
14.4
01/27/2022
1600
27.0
75.0
36
46.2
16.7
01/27/2022
1500
27.0
76.0
36
46.2
18.1
01/27/2022
1400
27.0
187.0
14
46.2
17.6
01/27/2022
1300
27.0
187.0
14
46.2
21.4
01/27/2022
1200
27.0
187.0
14
46.2
18.1
01/27/2022
1100
26.9
187.0
14
46.2
16.9
01/27/2022
1000
26.9
187.0
14
46.2
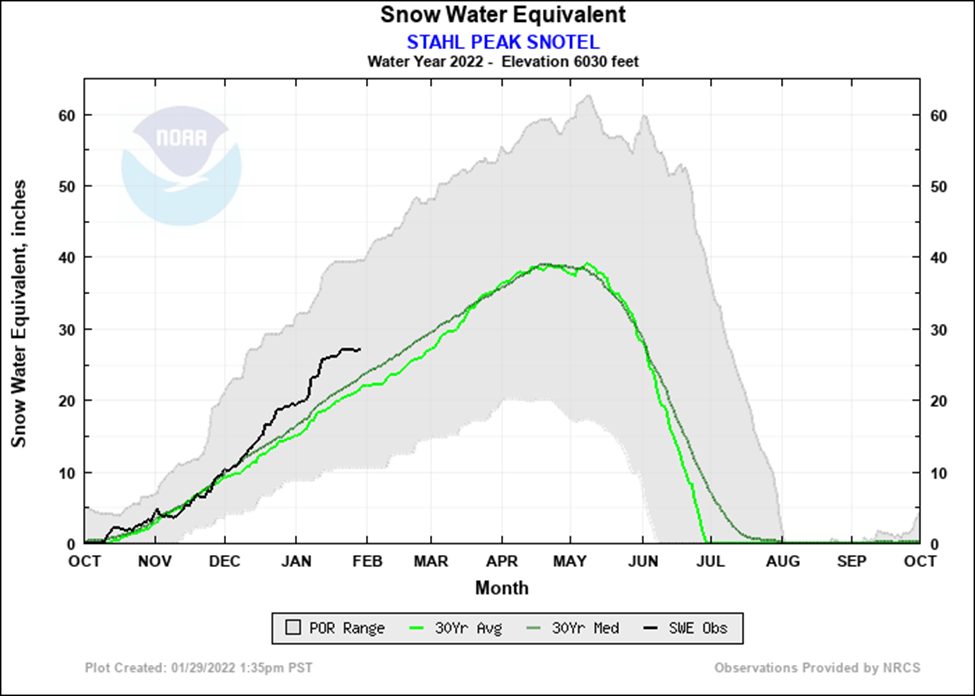
So what’s in store? As the chart below shows, there isn’t enough data yet for projecting seasonal precipitation reliably on the first day of February. Still, with the normal high around 39 inches on the first of May, we need only10 more inches of water to make it, spread over the next 90 days.
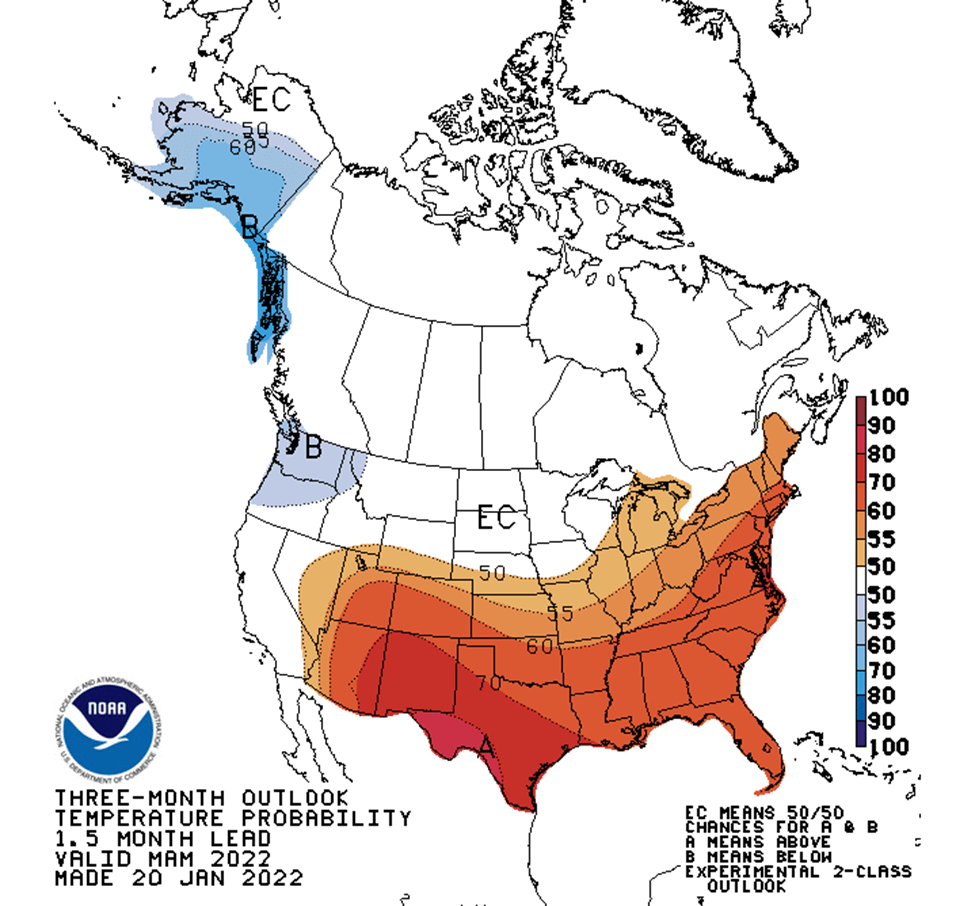
If you want more data relative to the upcoming temperature and precipitation projections, NOAA has the official long-lead forecasts available at: cpc.ncep.noaa.gov
It looks like our temperatures will be a little below normal for March-April-May, leading to a bit slower snow melt.
The precipitation probability is also above average – so things look good for the Spring.
As I look back, it is easy to see how a career starting in snow surveys provided good experience as I moved into demography. There really isn’t a lot of difference between projecting snow depth and human populations.
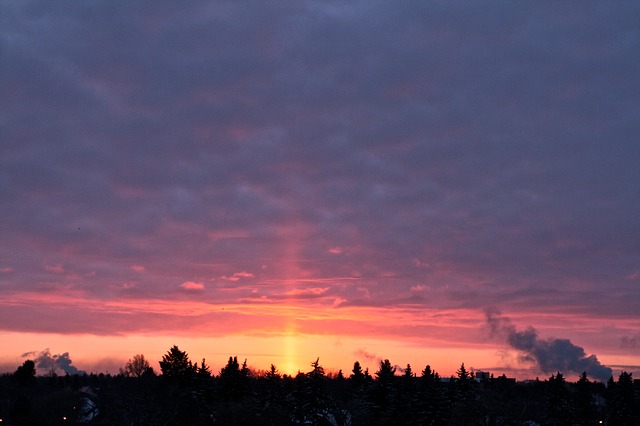
It’s that time of the year again, or rather the temperature is that low again. Strange pillars of light in the sky? Ice pillars, or light pillars, form under conditions of very cold temperatures.
Edmonton, Canada -not my photo, I wasn’t about to stay out in the cold long enough to take one!
They are caused by light being reflected by crystals in the atmosphere, and careful observation of them can actually provide some insights about the weather. The source of the reflected light can be anything from the sun to streetlights. Color will vary depending on the light source.
Since these require very dense, cold air, with many ice crystals, they are common in polar regions.
There was a meme out a while back, pointing out the differences between Fahrenheit, Celsius, and Kelvin. Measuring was a challenge in those early days – heck, measuring was a challenge to me after I had completed college classes on the topic. Somewhere in the Glen Lake Irrigation District files of “as built” projects, my blunder on the Tamboer Siphon may still be recorded – I carefully picked the best spot for an inlet structure, numbered it 0+00 and began surveying. A couple weeks later, I realized that I needed shots further upstream and had to start using negative numbers to finish the project. It was a solution, but not an elegant solution. After the experience, I started at 10+00. Less mockery occurs when your mistakes aren’t so obvious.
Anders Celsius made a similar blunder – he set the boiling point of water at 0 degrees and the freezing point at 100 degrees. Then as he continued his studies, he found that the boiling point of water changes with elevation (atmospheric pressure) while the freezing point of water was independent of both latitude and atmospheric pressure. After Celsius died, the Royal Swedish Academy of Sciences noted that Celsius’ successors had reversed the measurements. It does make more sense to start measuring from something constant.
The amazing thing about the Fahrenheit scale is that it came first. Without a consistent scale on the thermometer, the extra energy involved in shifting from water to ice (or vice versa) makes precise and accurate measurements somewhere between difficult and impossible. Fahrenheit chose to set his zero at the point that the reaction between ice, water and ammonium chloride quit working. Once he had that, and marked his thermometer, he could repeat his experiment and determine that he had a consistent zero, based on a chemical reaction. His next line was assuming the human body temperature was 100 degrees. Then he could measure the temperature of ice water. A bit of refinement, and freezing became 32 degrees, body temperature 96 degrees, and individual degrees could be measured by cutting the difference in half – 32 to 16, 16 to 8, 8 to 4, 4 to 2, and in 5 steps Fahrenheit had the gradations on his thermometer. In the US we still use his method, though the rest of the world uses the modification of the Celsius system.
William Thompson (Baron Kelvin) came up with the Kelvin scale in 1848 – where zero was based on his calculations of absolute zero. Thompson’s calculations showed absolute zero at -273 degrees centigrade. In the following century and a half, his calculations have been corrected to -273.15.
All told, it’s kind of humbling to see what these folks could do in the 18th and 19th centuries, without calculators and computers. Thermometers of sorts were invented long before – but developing a universal measuring scale was long in coming.
In the last half of the seventies, the Monday after Christmas was committed. I would meet Jay Penney at Graves Creek, get into the Snow Survey crummy and then we would measure the snow depth at Weasel Divide, Stahl Peak, and Graves Creek. It’s so long ago that none of our measurements remain in the 30 year average. We were the moderns – 440 cc Skidoo Alpines, and clockwork recorders that measured the snow-water equivalents through the month – all we needed to do was wind the clock and pack the chart away. The guys we followed had done things differently – drive up Burma Road, snowshoe or ski to Weasel Cabin, build a fire, measure the snow course, eat dinner, sleep, hike into Stahl the next morning, measure the snow course, camp in the lookout, hike down, measure Graves Creek, reach the road and drive back into town.
My work was transitory – duplicating the traditional measurement dates and working with new recorders, battery power, early solar cells, and working with the technology that would make us unnecessary.
My work was easier than my predecessors. I used snowshoes where I couldn’t take a snowmobile. Today, the remote monitoring is so good that I can click the link, and learn what the snowpack is on Stahl without leaving the warmth of my house. Try it, you’ll like it. https://www.nwrfc.noaa.gov/snow/snowplot.cgi?STAM8
Date
TimePST
Snow WaterEquivalent(inches)
SnowDepth(inches)
SnowDensity(%)
PrecipitationTo-Date(inches)
CurrentTemperature(degrees F)
12/27/2021
0900
18.9
67.0
28
36.9
6.6
12/27/2021
0800
18.9
67.0
28
36.9
7.0
12/27/2021
0700
18.9
67.0
28
36.9
5.0
12/27/2021
0600
18.9
67.0
28
36.9
3.0
12/27/2021
0500
18.9
67.0
28
36.9
3.0
12/27/2021
0400
18.9
67.0
28
36.9
2.1
12/27/2021
0300
18.9
67.0
28
36.9
0.9
12/27/2021
0200
18.9
67.0
28
36.9
4.6
12/27/2021
0100
18.9
68.0
28
36.9
2.1
12/27/2021
0000
18.9
68.0
28
36.9
13.6
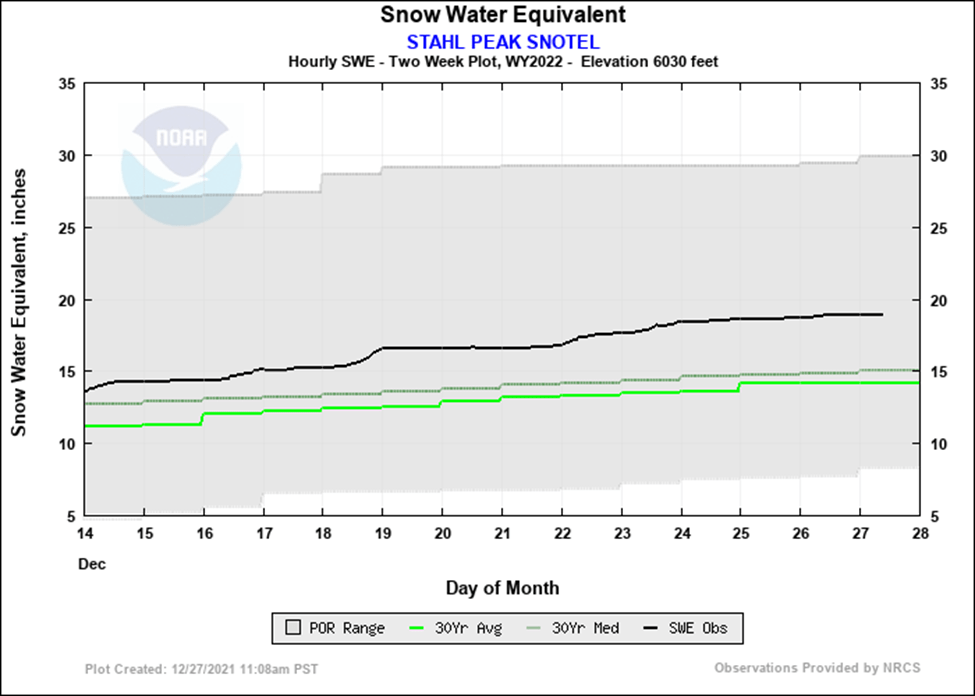
Nearly 19 inches of water in 67 inches of snow – 28% density, and warming after a near-zero night. Of course, this is what would have been the January 1 run, and definitely not the time to announce whether the year was a high or low snowpack. The next chart replaces the hand-written notes that Jay carried when I started, or that I carried after congestive heart failure took him off fortyfive time – 045 was the code we used for time spent on snow surveys.
26% above the thirty-year median. It’s a number, but if we use it, we’re projecting from too little data. Things can change with January and February’s snows – but above the mean is good. Full soil profiles are good for plant growth and delay the susceptibility to fire. And the Corps of Engineers paid that fortyfive time to get information to manage the reservoirs.
The next chart shows the 30 year mean, average and this year’s numbers in the lines – but the shaded area shows the variance. You may note that by August 1, the snow is always gone, but the chart shows that it has melted off by the first week of June.
As an old man, it’s good to be able to keep up on the information. We did haul a lot of equipment in and out on those Alpines to help move toward the automated systems we have today.