Trego's Mountain Ear

"Serving North Lincoln County"

Tag: Snow

  • The January Run

    It’s the week before Christmas. Fifty years ago, I was on a Ski-doo Alpine, making the January Run. It was a partial run – mostly for the purpose of rewinding the clockwork recorders that measured the height of the antifreeze solution as deeper snows compressed the snow pillows (a snow pillow is a rubber bladder, filled with antifreeze – I measured a lot of them, but rarely saw one).

    It’s a different world now – instead of pushing twin tracked snowmobiles up Grave Creek to sample Weasel Divide, then sample Stahl Peak and rewind the pillow, I can download the measurements from my armchair. Today, the only need for snow surveyors is to visit the site, and provide the measurements that allow the correlations with the (longer established) snow course. The real iron men of snow surveys were the generation before me – they did it all on skis and snowshoes.

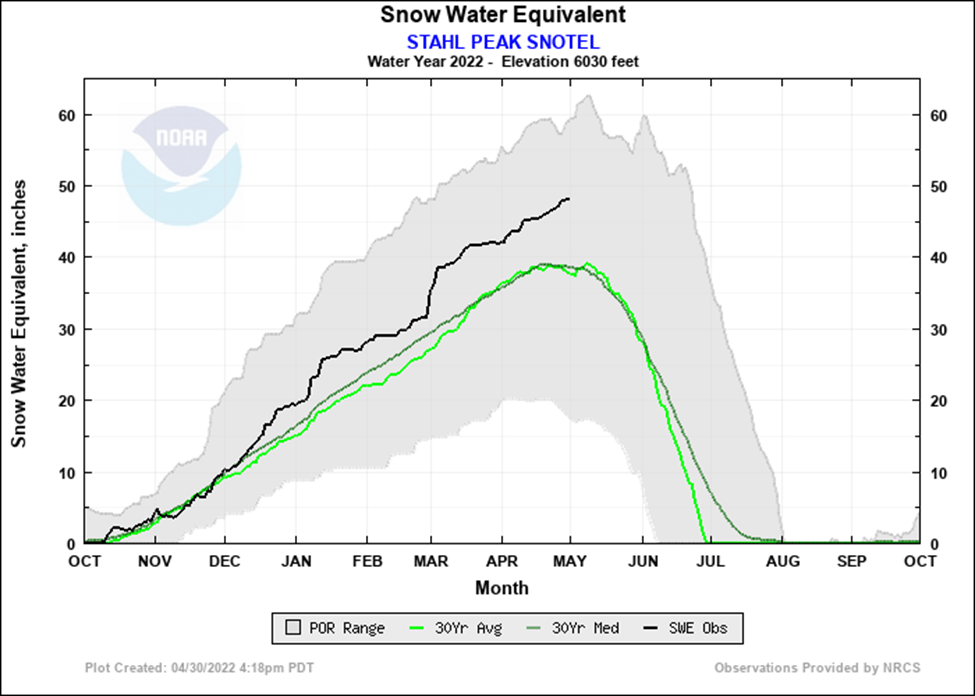
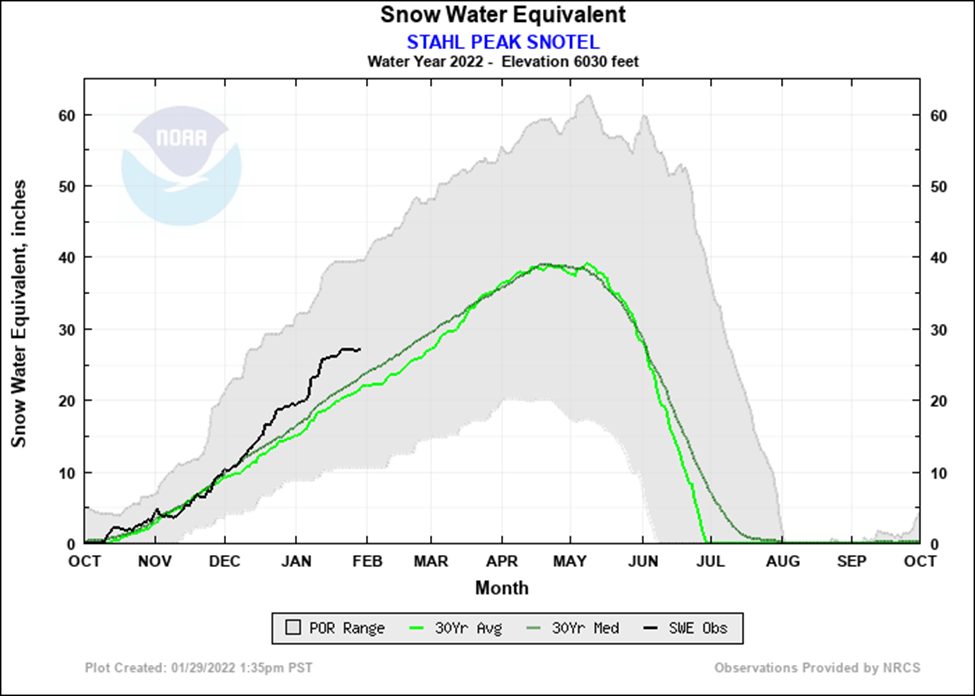
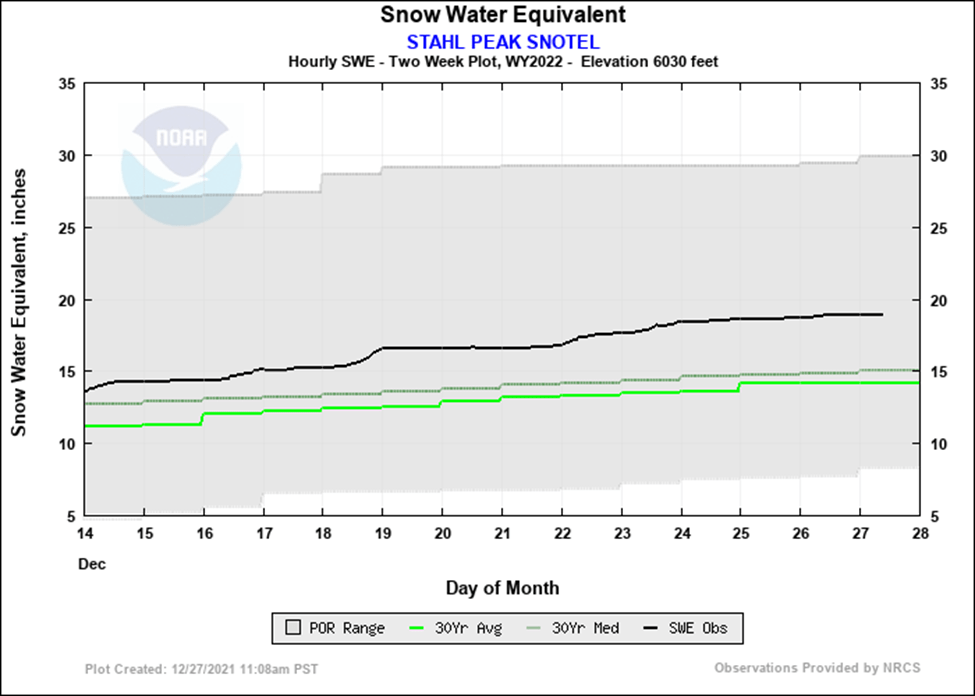
    So, in memory of the job that once brought me envy (“You really get paid to ride snowmobiles?”) Here’s what the data recorder has to say about Stahl Peak today:

    I like the chart – and the long-term data (for the last 30 years – it really does make me feel old to see that my measurements from 50 years ago, are so far in the past that they’re not included. But even a half century ago, I had learned that climate, like weather, changes – it’s just slower to change).

    6 Hour
    SWE Change
    (inches)
    12 Hour
    SWE Change
    (inches)
    24 Hour
    SWE Change
    (inches)
    48 Hour
    SWE Change
    (inches)
    1 Week
    SWE Change
    (inches)
    0.000.000.501.202.40
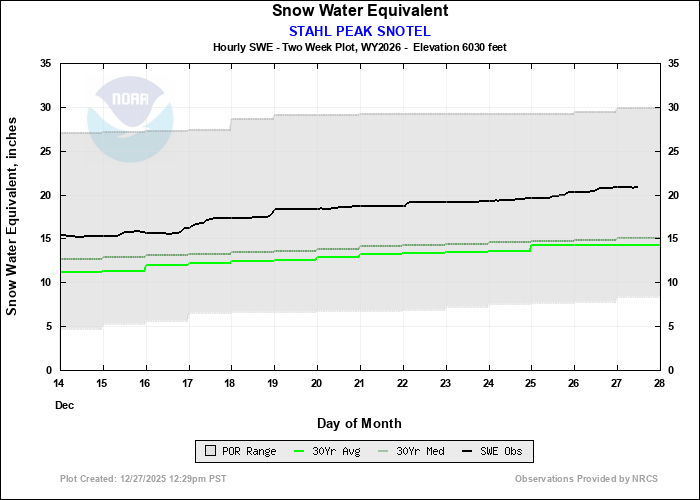
     Daily Statistics
    Latest Observation is 20.90 inches which is 147 % of average
     Note: The Median/Average is based upon the 30 year period 1991 to 2020.
    The Min/Max is based upon the Period Of Record (POR).

    So, at this time, the snowpack on Stahl is about 150% o the average. If you click on the NCRS site, you’ll see where the Kootenai basin sits:

    Basin
      Site Name
    Elev
    (ft)
    Snow Water EquivalentWater Year-to-Date Precipitation
    Current
    (in)
    Median
    (in)
    Pct of
    Median
    Current
    (in)
    Median
    (in)
    Pct of
    Median
    KOOTENAI RIVER BASIN
      Banfield Mountain55806.8   6.2   110   19.5   10.3   189   
      Bear Mountain546016.8   18.8   89   47.4   31.8   149   
      Garver Creek42503.3   4.7   70   15.2   9.0(24)169   
      Grave Creek43503.0   5.2   58   28.8   14.3   201   
      Hand Creek50303.6   3.9   92   11.6   7.2   161   
      Hawkins Lake646014.3   9.8   146   25.8   15.2   170   
      Poorman Creek50508.8   11.4(22)77   46.1   25.9(22)178   
      Stahl Peak604020.9   14.2   147   27.1   18.2   149   
    Basin Index (%)104   168

    The percentages are impressive – but there is a lot of winter yet to come. I don’t have data based on the Bouyoucos blocks we once measured to show how much moisture is stored in the soil at the sites – but I’d bet the soil moisture is at 100% capacity too.

    It’s a pleasant thing that the data is so readily available anymore.

  • In the Seventies, it took a Week’s Work

    Now it takes a single click to get the data. So what does it mean?  I measured the record lows back in 1977 – this chart, from the Grave Creek site, shows how the critical snowfall that brings us up to normal or above occurs between the February measurements and April 1.  I don’t know if my record measurements will stand or not – but being the guy who measured something for the records doesn’t count for much. 

    Basin   Site NameElev (ft)Snow Water EquivalentWater Year-to-Date Precipitation
    Current (in)Median (in)Pct of MedianCurrent (in)Median (in)Pct of Median
    KOOTENAI RIVER BASIN
      Banfield Mountain56006.3  11.6  54  13.3  16.9  79  
      Bear Mountain540022.3  35.6  63  39.4  48.0  82  
      Garver Creek42504.8  6.8  71  9.4  13.2(24)71  
      Grave Creek43008.8  10.7  82  22.7  22.0  103  
      Hand Creek50355.4  7.4  73  8.8  11.9  74  
      Hawkins Lake64508.7  16.5  53  17.7  21.2  83  
      Poorman Creek510012.6  23.4(22)54  27.6  39.1(22)71  
      Stahl Peak603021.4  22.0  97  28.5  26.2  109  
    Basin Index (%)67  84  
     
  • Stahl Peak Snow Pack Still Increasing

    Stahl Peak Snow Pack Still Increasing

    This graph, from 4-30-22 shows that the snowpack on Stahl is still increasing.  The upper line on the record suggests that there’s only a week or so left for it to increase.  Still, 127% of the long-term average is nice to see.

    NOAA has this posted for May-June-July, suggesting we can expect the chances of warmer temperatures and less than normal precipitation coming up.

  • Monitoring Snow- the Easy Way

    Monitoring Snow- the Easy Way

    Times have changed.  In the seventies, I would have been up and out this morning to snowmobile in to Weasel Divide, Stahl Peak, and Grave Creek snow courses, and worked the details out in the evening in a Libby motel room.  Now, I can get the data in my kitchen by clicking a link.

    So we’re going into February at 127% of average – 5 ½ inches of water more.  Something interesting happened between 2:00 pm and 3:00 pm on January 27 – the snow depth reported went from 187 inches to 75 inches, while the snow water equivalent stayed the same at 27 inches.  This is why we carried so many spare parts on the back of the old Ski-doo Alpines – one ski up front, two tracks behind, and a small pickup bed behind the seat.  Monitoring equipment needs to be monitored.

    DateTime PSTSnow Water Equivalent (inches)Snow Depth (inches)Snow Density (%)Precipitation To-Date (inches)Current Temperature (degrees F)
    01/28/2022090026.9187.01446.118.0
    01/28/2022080026.9187.01446.116.9
    01/28/2022070026.9187.01446.212.4
    01/28/2022060026.9187.01446.112.4
    01/28/2022050026.9187.01446.112.9
    01/28/2022040026.9187.01446.113.1
    01/28/2022030026.9187.01446.215.4
    01/28/2022020026.9187.01446.215.1
    01/28/2022010026.9187.01446.213.3
    01/28/2022000026.975.03646.214.5
    01/27/2022230026.9187.01446.212.7
    01/27/2022220026.975.03646.213.5
    01/27/2022210026.976.03546.213.6
    01/27/2022200026.976.03546.214.0
    01/27/2022190026.976.03546.214.2
    01/27/2022180026.976.03546.213.8
    01/27/2022170027.076.03646.214.4
    01/27/2022160027.075.03646.216.7
    01/27/2022150027.076.03646.218.1
    01/27/2022140027.0187.01446.217.6
    01/27/2022130027.0187.01446.221.4
    01/27/2022120027.0187.01446.218.1
    01/27/2022110026.9187.01446.216.9
    01/27/2022100026.9187.01446.2   

    So what’s in store?  As the chart below shows, there isn’t enough data yet for projecting seasonal precipitation reliably on the first day of February.  Still, with the normal high around 39 inches on the first of May, we need only10 more inches of water to make it, spread over the next 90 days.

    If you want more data relative to the upcoming temperature and precipitation projections, NOAA has the official long-lead forecasts available at:  cpc.ncep.noaa.gov

    It looks like our temperatures will be a little below normal for March-April-May, leading to a bit slower snow melt.

    The precipitation probability is also above average – so things look good for the Spring.

    As I look back, it is easy to see how a career starting in snow surveys provided good experience as I moved into demography.  There really isn’t a lot of difference between projecting snow depth and human populations.

  • Time to Look at Snow

    In the last half of the seventies, the Monday after Christmas was committed.  I would meet Jay Penney at Graves Creek, get into the Snow Survey crummy and then we would measure the snow depth at Weasel Divide, Stahl Peak, and Graves Creek.  It’s so long ago that none of our measurements remain in the 30 year average.  We were the moderns – 440 cc Skidoo Alpines, and clockwork recorders that measured the snow-water equivalents through the month – all we needed to do was wind the clock and pack the chart away.  The guys we followed had done things differently – drive up Burma Road, snowshoe or ski to Weasel Cabin, build a fire, measure the snow course, eat dinner, sleep, hike into Stahl the next morning, measure the snow course, camp in the lookout, hike down, measure Graves Creek, reach the road and drive back into town.

    My work was transitory – duplicating the traditional measurement dates and working with new recorders, battery power, early solar cells, and working with the technology that would make us unnecessary. 

    My work was easier than my predecessors.  I used snowshoes where I couldn’t take a snowmobile.  Today, the remote monitoring is so good that I can click the link, and learn what the snowpack is on Stahl without leaving the warmth of my house.  Try it, you’ll like it.  https://www.nwrfc.noaa.gov/snow/snowplot.cgi?STAM8

    DateTime PSTSnow Water Equivalent (inches)Snow Depth (inches)Snow Density (%)Precipitation To-Date (inches)Current Temperature (degrees F)
    12/27/2021090018.967.02836.96.6
    12/27/2021080018.967.02836.97.0
    12/27/2021070018.967.02836.95.0
    12/27/2021060018.967.02836.93.0
    12/27/2021050018.967.02836.93.0
    12/27/2021040018.967.02836.92.1
    12/27/2021030018.967.02836.90.9
    12/27/2021020018.967.02836.94.6
    12/27/2021010018.968.02836.92.1
    12/27/2021000018.968.02836.913.6

    Nearly 19 inches of water in 67 inches of snow – 28% density, and warming after a near-zero night.  Of course, this is what would have been the January 1 run, and definitely not the time to announce whether the year was a high or low snowpack.  The next chart replaces the hand-written notes that Jay carried when I started, or that I carried after congestive heart failure took him off fortyfive time – 045 was the code we used for time spent on snow surveys.

    26% above the thirty-year median.  It’s a number, but if we use it, we’re projecting from too little data.  Things can change with January and February’s snows – but above the mean is good.  Full soil profiles are good for plant growth and delay the susceptibility to fire.  And the Corps of Engineers paid that fortyfive time to get information to manage the reservoirs.

    The next chart shows the 30 year mean, average and this year’s numbers in the lines – but the shaded area shows the variance.  You may note that by August 1, the snow is always gone, but the chart shows that it has melted off by the first week of June. 

    As an old man, it’s good to be able to keep up on the information.  We did haul a lot of equipment in and out on those Alpines to help move toward the automated systems we have today.

  • Snow Pack on March 1

    The long-term average for snow surveys were dated for the first of the month when I started measuring snow 45 years ago.  The old guys did it the hard way – up Burma Road early, skis or snowshoes to the Weasel Cabin, build a fire, sample the snow course, then overnight.  The next day they would head down the creek, then climb Stahl, build a fire, sample the snow course, then hike out the next morning, sample the course at Grave Creek, hike the rest of the way out and finish the job driving the pickup out.  As a modern, I drove a snowmobile and did 3 snow courses in a day.  Now I click a link on the home computer, and can look at the whole basin’s information in minutes.

    The numbers from March 1 were kind of sacred – there had been enough winter that Jay Penney felt safe projecting the data – enough was in that he would comment that the snowpack was light, normal or heavy.

    These are some of the snow courses I measured in those middle days, when we thought a snowmobile was absolutely modern, and were experimenting with measuring snow water at Noisy Basin with a radioactive source and receiver.  We were state of the art back then.     

    ElevationWater EquivalentPercent of Average
    Banfield Mountain5600 feet13.1 inches88%
    Hawkins Lake6450 feet18.9 inches94%
    Garver Creek4250 feet8.4 inches101%
    Stahl Peak6030 feet24.4 inches86%
    Grave Creek4300 feet13.1 inches87%
    Poorman Creek5100 feet29.4 inches95%
    Bear Mountain5400 feet45.6 inches87%
    Hand Creek5035 feet9.2 inches102%
    Noisy Basin6040 feet31.5 inches106%
    To get to the data – and the map – you just click https://www.nwrfc.noaa.gov/snow/ . Making the data so available makes hydrology a science for everyone.