It still amazes me that I can turn on the computer and, in 15 minutes, get the data that used to take a week’s work to obtain. Of course it also amazes me that my work is so far in the past that it no longer shows up in the 30-year averages. Still, some of that data – starting with my first run in the mid-seventies are still available:

As I look at the little squares on the left, I do see that Jay and I did measure the lowest year on this chart, back in 1977.
My closest snow courses are Stahl Peak and Grave Creek. Stahl is listed at 27.7 inches and 75% of average – but still significantly better than the 20-inches of water back in my youth.
Grave Creek is listed at 3.8 inches and 60% of average.
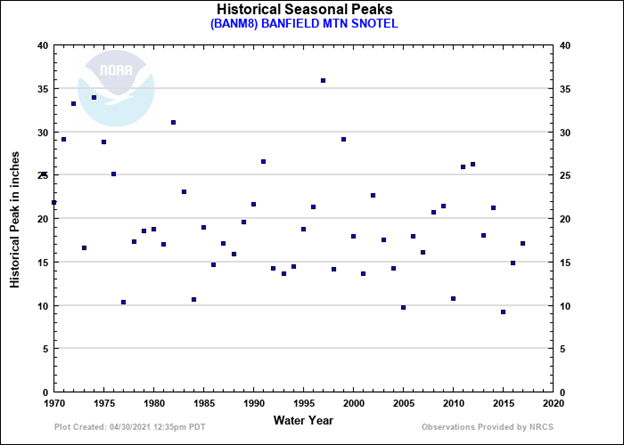
Banfield Mountain shows 9.9 inches – 66% of average. The chart shows that this is fairly close to the record low measurements.

Hawkins Lake, in the northwest corner of the county, shows 20.9 inches and 81% of the 30 year average. The historic peaks chart shows that I measured the record low in 1977, and the snowpack is still above that.
Leave a Reply