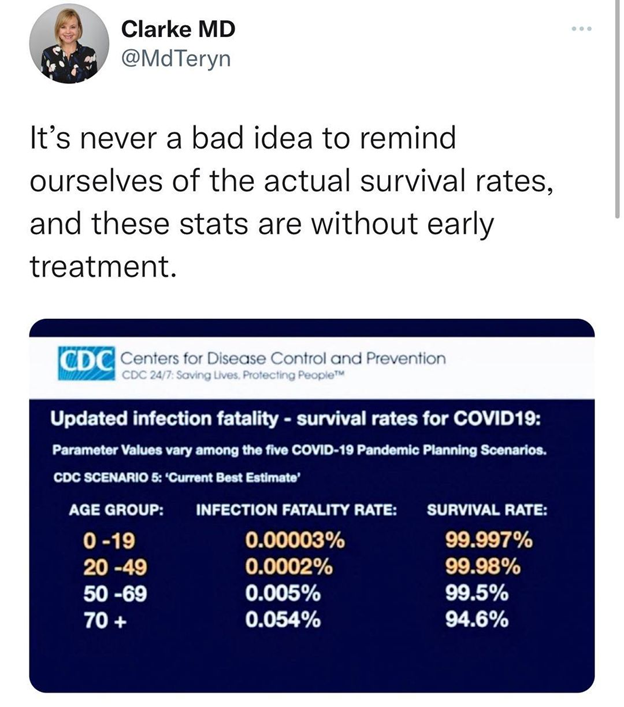
This offers a perspective on covid survival rates, but screws up some simple statistics:

| 0-19 | 20-49 | 50-69 | 70+ |
|---|---|---|---|
| 100.000% | 100.000% | 100.000% | 100.000% |
| -99.997% | -99.98% | -99.5% | -94.6% |
| 0.003% | 0.02% | 0.5% | 5.4% |
It’s official data. It purports to be from CDC. The author implies possession of a MD.
The math is screwed up. By a factor of 100. I learned the difference between decimals and percentages in the fifth or sixth grade – this isn’t a mistake at a graduate stats level, or even freshman stats. It appears someone releasing official data screwed up. We need to check the math even on official data.
This site https://lincolnmtcovid.com/ has local numbers – and you can contrast them against the CDC statistics:

The local numbers show some anomalies when we compare and contrast them with CDC statistics. The Libby area shows a cumulative 1,190 cases (in a population of 9,772 that’s 12.2%). North County shows 467 cases (in a population of 6,470 that’s 7.2%) and Troy shows 258 cases (in a population of 3,435 that’s 7.5%).
Lincoln County death rates can’t be contrasted with the CDC percentages – the tyranny of small numbers makes it impossible. That said, in the 70+ age range that the CDC figures identify as a (corrected) 5.4% infection fatality rate, Lincoln County’s charts show 24 deaths in 311 cases – 7.8% – 44% more fatalities than national statistics. The 3 deaths in the 50-69 age range, with 557 total cases work out amazingly close to the national 0.5% infection fatality rate.
There’s not enough data for me to infer causality. It is good to have local data available – and I do wonder why the infection rate is higher in Libby. Checking the math when you can is a good idea.
Leave a Reply