-
Years ago someone told me “Americans are benevolently ignorant about what goes on in Canadian politics, but Canadians are malevolently well informed about American politics.” I’m really noticing how uninformed I’ve been about Canada’s politics as I watch the election move along and pay a bit more attention. I’ve been downright intrigued as Alberta’s Premier keeps heading south to visit Trump.
So I’ve done a bit of reading about Canada’s provincial equalization. Wikipedia explains it: “In Canada, the federal government makes equalization payments to provincial governments of lesser fiscal capacity so that “reasonably comparable” levels of public services can be provided at similar levels of taxation.[1] Equalization payments are entrenched in the Constitution Act of 1982, subsection 36(2).[2]”
It reminds me of Montana’s equalization for school taxation – and this map shows which provinces make out on the equalization:

It’s pretty obvious that the provinces colored black are taxed for the benefit of the eastern provinces. The map shows why Danielle Smith visits Trump – Alberta is shafted so much by the eastern provinces that Trump’s tariff’s have trouble registering.
That 13.3 billion dollar (Canadian) equalization in Quebec keeps Quebec from threatening to secede. Equalization cost Alberta $67 billion. What has it bought? Hostility – Canadian Energy News, Top Headlines, Commentaries, Features & Events – EnergyNow went to print in 2021 – here’s what the numbers looked like four years ago:
“Sixty-seven billion dollars.
That’s how much the federal government’s equalization scheme has cost Alberta taxpayers since its inception in 1957.
This year, equalization will cost Alberta taxpayers nearly $3 billion. That means that equalization will cost an Alberta family of four about $2,600 this year on average.
Since equalization was created, Albertans have received less than 0.02% of all equalization payments. The last penny paid to Wild Rose County from equalization was all the way back in 1965.
Equalization is only one federal program that redistributes money away from Alberta taxpayers. After considering all the money the feds tax and spend, Albertans have paid more than $600 billion more to Ottawa than the province received back in federal spending since 1961.”
I never realized – benevolently ignorant, remember – just how much Alberta is exploited to keep Quebec in Canada. Now, it looks like some of the Albertans are tired of their system. As close as we are to Canada, we probably should pay more attention to what goes on with their politics.
-

The COVID-19 pandemic merely accelerated a trend that began in 2003. C.P. George/ClassicStock via Getty Images Brian D. Taylor, University of California, Los Angeles; Eric Morris, Clemson University, and Sam Speroni, University of California, Los Angeles
In his February 2025 cover story for The Atlantic, journalist Derek Thompson dubbed our current era “the anti-social century.”
He isn’t wrong. According to our recent research, the U.S. is becoming a nation of homebodies.
Using data from the American Time Use Survey, we studied how people in the U.S. spent their time before, during and after the pandemic.
The COVID-19 pandemic did spur more Americans to stay home. But this trend didn’t start or end with the pandemic. We found that Americans were already spending more and more time at home and less and less time engaged in activities away from home stretching all the way back to at least 2003.
And if you thought the end of lockdowns and the spread of vaccines led to a revival of partying and playing sports and dining out, you would be mistaken. The pandemic, it turns out, mostly accelerated ongoing trends.
All of this has major implications for traffic, public transit, real estate, the workplace, socializing and mental health.
Life inside
The trend of staying home is not new.
There was a steady decline in out-of-home activities in the two decades leading up to the pandemic.

Compared with 2003, Americans in 2019 spent nearly 30 minutes less per day on out-of-home activities and eight fewer minutes a day traveling. There could be any number of reasons for this shift, but advances in technology, whether it’s smartphones, streaming services or social media, are likely culprits. You can video chat with a friend rather than meeting them for coffee; order groceries through an app instead of venturing to the supermarket; and stream a movie instead of seeing it in a theater.
Of course, there was a sharp decline in out-of-home activities during the pandemic, which dramatically accelerated many of these stay-at-home trends.
Outside of travel, time spent on out-of-home activities fell by over an hour per day, on average, from 332 minutes in 2019 to 271 minutes in 2021. Travel, excluding air travel, fell from 69 to 54 minutes per day over the same period.
But even after the pandemic lockdowns were lifted, out-of-home activities and travel through 2023 remained substantially depressed, far below 2019 levels. There was a dramatic increase in remote work, online shopping, time spent using digital entertainment, such as streaming and gaming, and even time spent sleeping.
Time spent outside of the home has rebounded since the pandemic, but only slightly. There was hardly any recovery of out-of-home activities from 2022 to 2023, meaning 2023 out-of-home activities and travel were still far below 2019 levels. On the whole, Americans are spending nearly 1.5 hours less outside their homes in 2023 than they did in 2003.
While hours worked from home in 2022 were less than half of what they were in 2021, they’re still about five times what they were ahead of the pandemic. Despite this, only about one-quarter of the overall travel time reduction is due to less commuting. The rest reflects other kinds of travel, for activities such as shopping and socializing.
Ripple effects
This shift has already had consequences.
With Americans spending more time working, playing and shopping from home, demand for office and retail space has fallen. While there have been some calls by major employers for workers to spend more time in the office, research suggests that working from home in the U.S. held steady between early 2023 and early 2025 at about 25% of paid work days. As a result, surplus office space may need to be repurposed as housing and for other uses.
There are advantages to working and playing at home, such as avoiding travel stress and expenses. But it has also boosted demand for extra space in apartments and houses, as people spend more time under their own roof. It has changed travel during the traditional morning – and, especially, afternoon – peak periods, spreading traffic more evenly throughout the day but contributing to significant public transit ridership losses. Meanwhile, more package and food delivery drivers are competing with parked cars and bus and bike lanes for curb space.
Perhaps most importantly, spending less time out and about in the world has sobering implications for Americans well beyond real estate and transportation systems.
Research we’re currently conducting suggests that more time spent at home has dovetailed with more time spent alone. Suffice it to say, this makes loneliness, which stems from a lack of meaningful connections, a more common occurrence. Loneliness and social isolation are associated with increased risk for early mortality.
Because hunkering down appears to be the new norm, we think it’s all the more important for policymakers and everyday people to find ways to cultivate connections and community in the shrinking time they do spend outside of the home.
Brian D. Taylor, Professor of Urban Planning and Public Policy, University of California, Los Angeles; Eric Morris, Professor of City and Regional Planning, Clemson University, and Sam Speroni, PhD Student in Urban Planning, University of California, Los Angeles
This article is republished from The Conversation under a Creative Commons license. Read the original article.
-
First, an explanation: What is the school transportation fund used for?
While we could go read through MT Code Annotated, the faster way to find this information is the school accounting manual (link to pdf download). Since that’s over 400 pages- I’m going to provide the relevant excerpt.
TRANSPORTATION FUND – Authorized by Section 20-10-143, MCA, for the purpose of financing the maintenance and operation of district owned school buses, contracts with private carriers for school bus service, individual transportation contracts, and any amount necessary for the purchase, rental, or insurance of yellow school buses or operation of the transportation program. The fund may be used only to support costs of
home-to-school transportation.So, in brief: The school transportation is only for transporting students between home and school. It can pay for the fuel, the insurance, the maintenance, and the bus driver.
We’ve been comparing local elementary districts, and we’ll continue to do so. If you’ve been downloading the school budgets, you’ll find these about 8 pages into the files.
Transportation Funding for 24/25 School Year
Funding Source Trego Fortine Olney-Bissell County Reimbursement $12,353.21 $15,378.66 $27,017.92 State Reimbursement $18,311.04 $15,378.66 $27,017.92 District Levy 0.0 $69,242.68 $158,308.00 Total: $40,000 $100,000 $212,343.85 First obvious question: Why are the reimbursement rates not the same for Trego? Because Trego was able to offset them by lowering the budget. It probably didn’t lower your personal taxes all that much, since that savings was distributed across the county, but it had some impact.
Next, since it’s fairly obvious that Trego, with no local levy, is a bit of an anomaly, we’ll look at Trego Elementary over time.
Funding Source 21/22 22/23 23/24 24/25 County $17,873.06 $17,960.04 $18,311.04 $12,353.21 State $17,873.07 $17,960.04 $18,311.04 $18,311.04 District $13,253.87 $13,079.92 $5,657.35 $0.0 Total: $49,000.00 $49,000.00 $49,000.00 $40,000.00 Trego’s evidently dropped an already small levy over the past two years. The reimbursement received from the county is disproportionately large, when compared to the other two schools. This doesn’t necessarily mean something’s been calculated/reported incorrectly, but it raises the possibility and suggests a closer look at how that reimbursement is calculated is probably merited.
As a component of the whole transportation budget, Fortine receives 30% from the state/county. Olney-Bissell? 25% And for Trego?
Percent of Transportation Budget Coming From State/County Reimbursement by Year for Trego Elementary
Year 21/22 22/23 23/24 24/25 Percentage 72.95 73.30 88.45 100 Weirdly high, even several years ago. Nice for the local tax payer, but odd enough to warrant a closer look. An additional puzzle: Is it common for school districts to have the same transportation budget from year to year? I don’t know- but we can certainly take a closer look at Fortine and Olney-Bissell. More on transportation next week!
A reminder: We’re looking more closely at transportation, because transportation is the major levy difference between Trego Elementary and its two adjacent elementary districts.
-
This year, we’re having to pass a special levy to pay tuition to the schools that take Trego students in from out of district. It’s one of those things about taxation with representation – the only votes from folks we can elect came from Mike Cuffe and Neil Durum (neither of whom is a Trego taxpayer). Frankly, Zooey Zephyr (D-Missoula) has done a better job representing Trego than either our state senator or state representative. What the hey – we tend to vote in people who are likable, and both Mike and Neil are easy to like.
Our property taxes fund the schools – and the school taxes are just a little over 6/10th of the total property tax bill. Let’s look at where those school taxes actually go, and how much they cost me on one piece of property:
State School Levy (Helena bound) 95 mills $103.26 State Levy (University support) 6 mills 6.52 Countywide Education (Libby) 18.24 mills 19.83 Elementary General (Trego) 38.28 mills 41.63 Elementary Bus Depreciation (Trego) 8.28 mills 9.00 Elementary Building Reserve (Trego) 2.08 mills 2.26 HS General (LCHS) 12.89 mills 14.01 HS Transportation (LCHS) 5.84 mills 6.35 HS Bus Depreciation (LCHS) 2.64 mills 2.87 HS Tuition (LCHS) .03 mill .03 HS Building Reserve (LCHS) 1.08 mill 1.08 We don’t get to vote on the state school levy – it all goes to Helena, and then a portion (a bloody small portion) comes back to our schools. Basically half of our school taxes go to Helena for redistribution (I think the word they use is equalization.) We don’t get to vote on it, and the last time our commissioners tried to cut it down we were court ordered to pay up. It’s what they call taxation without representation . . . or possibly taxation with the representation coming from Mike and Neil. I think the American revolution came about because of this quality of representation – but keep reading – it gets worse.
The 6 mill levy is something we get to vote on every ten years as I recall. No complaints there – I attended Montana universities.
The countywide education levy is decided by the commissioners when they meet – so we get some indirect representation there.
The Elementary levies – a total of 48.64 mills (about a quarter of a Trego landowner’s school taxes – are the only spot the local board gets a vote. Partial control over these levies are what you’re voting for in the school board elections.
Now the high school levies are something Eureka residents have a say in – but Trego residents effectively had their input taken away in 1988, when there was an election to unify the high school and grade school – and it passed, but they couldn’t unify the districts without changing the name of Lincoln County High School. I couldn’t find the minutes that went back on the unification (and don’t blame Joel because he searched along with me). My scientific wild assed guess is that someone pulled them and disposed of them long before Joel and I looked for them.
The crux is that the 5 Eureka Elementary trustees make all the decisions for the high school. Sure, there’s a position for a Trego resident on the board – but my thoughts when the topic came up were simply “Why would I want to be on a board where I’ll be outvoted if I try to represent my constituency?” It’s a token position, lacking any real opportunity for input.
Fundamentally, 75% of the school taxes for Trego residents are taxes assessed without representation. The High School bus no longer picks up high school kids any further up the creek than Trego school (I remember when Mrs. Gilmond ran the route to pick us up). Well, we have a token Trego representative on that board, so maybe she can get changes made . . . and pigs may fly, but I doubt it.
Please, as you read this, remember that I support public education. And I also support representative government. I’ll continue to vote against Mike Cuffe and Neil Durum – I like both as individuals, but they have voted against my best interests, and do not merit my vote. If Zoey Zephyr ever runs against either, my decision is made – I’ll vote for the best man.
-
The link to find the school rankings for Montana is: https://www.schooldigger.com/go/MT/schoolrank.aspx
It shows me, at Trego, the challenges of getting a team of top teachers together. When I took Colorado’s Vocational Education class, I walked away with this phrase written on the blackboard of my mind: “If the student hasn’t learned, the teacher hasn’t taught.” In the past 40 years, I’ve encountered some teachers who accept that judgemental phrase – and more who attempt to explain why it’s wrong.
I can accept our rating as a one star school – though why our higher percentage of students who qualify for free and reduced lunches puts us behind our neighboring one star Fortine is beyond me. I figure that, with the teaching staff we have now, the future is bright – regardless of who pays for lunch.
After all, Belt High School, with 98 students and a third of them on free and reduced lunches stands in first place among Montana’s high schools. The impressive thing is that they were number six last year. Gallatin County’s high schools continue to fill most of the top ten – but our neighboring Whitefish is listed as number 8 (it was 9th last year).
Libby scored 31st in this last round – down from 13th. Lincoln County High School came in at 82nd out of 122 high schools. This is up from 85th in the previous year – but there were 124 high schools listed then, so the improvement may just be a numerical artifact. This is what the report says about our high school:
“Eureka Elementary School has shown steady improvement in its state-wide ranking, moving from 181 out of 356 in 2020-2021 to 87 out of 332 in 2022-2023, and earning a 4-star rating from SchoolDigger. This consistent progress, coupled with a relatively low student-to-teacher ratio of 13.4, suggests that the school is providing a quality educational experience for its 261 students. In contrast, Lincoln County High School has experienced a significant drop in its state-wide ranking, from 36 out of 114 in 2021-2022 to 85 out of 124 in 2022-2023, despite maintaining a 2-star rating from SchoolDigger.”
Troy High School scored 97th – a tremendous drop from the previous year’s 33rd place.
“Schooldigger calculates school rankings based on Montana State Tests Mathematics, Montana State Tests Reading, Montana State Tests Science test scores released by the Montana Office of Public Instruction.”
I’m looking forward to seeing Trego’s scores in 2027 – when they will reflect our changes and improvements in teaching.
-
A beautiful kitchen to scroll past – but check out the clock. Tiny Homes via Facebook Arryn Robbins, University of Richmond
I’m more of a scroller than a poster on social media. Like many people, I wind down at the end of the day with a scroll binge, taking in videos of Italian grandmothers making pasta or baby pygmy hippos frolicking.
For a while, my feed was filled with immaculately designed tiny homes, fueling my desire for minimalist paradise. Then, I started seeing AI-generated images; many contained obvious errors such as staircases to nowhere or sinks within sinks. Yet, commenters rarely pointed them out, instead admiring the aesthetic.
These images were clearly AI-generated and didn’t depict reality. Did people just not notice? Not care?
As a cognitive psychologist, I’d guess “yes” and “yes.” My expertise is in how people process and use visual information. I primarily investigate how people look for objects and information visually, from the mundane searches of daily life, such as trying to find a dropped earring, to more critical searches, like those conducted by radiologists or search-and-rescue teams.
With my understanding of how people process images and notice − or don’t notice − detail, it’s not surprising to me that people aren’t tuning in to the fact that many images are AI-generated.
We’ve been here before
The struggle to detect AI-generated images mirrors past detection challenges such as spotting photoshopped images or computer-generated images in movies.
But there’s a key difference: Photo editing and CGI require intentional design by artists, while AI images are generated by algorithms trained on datasets, often without human oversight. The lack of oversight can lead to imperfections or inconsistencies that can feel unnatural, such as the unrealistic physics or lack of consistency between frames that characterize what’s sometimes called “AI slop.”
Despite these differences, studies show people struggle to distinguish real images from synthetic ones, regardless of origin. Even when explicitly asked to identify images as real, synthetic or AI-generated, accuracy hovers near the level of chance, meaning people did only a little better than if they’d just guessed.
In everyday interactions, where you aren’t actively scrutinizing images, your ability to detect synthetic content might even be weaker.
Attention shapes what you see, what you miss
Spotting errors in AI images requires noticing small details, but the human visual system isn’t wired for that when you’re casually scrolling. Instead, while online, people take in the gist of what they’re viewing and can overlook subtle inconsistencies.
Visual attention operates like a zoom lens: You scan broadly to get an overview of your environment or phone screen, but fine details require focused effort. Human perceptual systems evolved to quickly assess environments for any threats to survival, with sensitivity to sudden changes − such as a quick-moving predator − sacrificing precision for speed of detection.
This speed-accuracy trade-off allows for rapid, efficient processing, which helped early humans survive in natural settings. But it’s a mismatch with modern tasks such as scrolling through devices, where small mistakes or unusual details in AI-generated images can easily go unnoticed.
People also miss things they aren’t actively paying attention to or looking for. Psychologists call this inattentional blindness: Focusing on one task causes you to overlook other details, even obvious ones. In the famous invisible gorilla study, participants asked to count basketball passes in a video failed to notice someone in a gorilla suit walking through the middle of the scene.
If you’re counting how many passes the people in white make, do you even notice someone walk through in a gorilla suit?
Similarly, when your focus is on the broader content of an AI image, such as a cozy tiny home, you’re less likely to notice subtle distortions. In a way, the sixth finger in an AI image is today’s invisible gorilla − hiding in plain sight because you’re not looking for it.
Efficiency over accuracy in thinking
Our cognitive limitations go beyond visual perception. Human thinking uses two types of processing: fast, intuitive thinking based on mental shortcuts, and slower, analytical thinking that requires effort. When scrolling, our fast system likely dominates, leading us to accept images at face value.
Adding to this issue is the tendency to seek information that confirms your beliefs or reject information that goes against them. This means AI-generated images are more likely to slip by you when they align with your expectations or worldviews. If an AI-generated image of a basketball player making an impossible shot jibes with a fan’s excitement, they might accept it, even if something feels exaggerated.
While not a big deal for tiny home aesthetics, these issues become concerning when AI-generated images may be used to influence public opinion. For example, research shows that people tend to assume images are relevant to accompanying text. Even when the images provide no actual evidence, they make people more likely to accept the text’s claims as true.
Misleading real or generated images can make false claims seem more believable and even cause people to misremember real events. AI-generated images have the power to shape opinions and spread misinformation in ways that are difficult to counter.
Beating the machine
While AI gets better at detecting AI, humans need tools to do the same. Here’s how:
- Trust your gut. If something feels off, it probably is. Your brain expertly recognizes objects and faces, even under varying conditions. Perhaps you’ve experienced what psychologists call the uncanny valley and felt unease with certain humanoid faces. This experience shows people can detect anomalies, even when they can’t fully explain what’s wrong.
- Scan for clues. AI struggles with certain elements: hands, text, reflections, lighting inconsistencies and unnatural textures. If an image seems suspicious, take a closer look.
- Think critically. Sometimes, AI generates photorealistic images with impossible scenarios. If you see a political figure casually surprising baristas or a celebrity eating concrete, ask yourself: Does this make sense? If not, it’s probably fake.
- Check the source. Is the poster a real person? Reverse image search can help trace a picture’s origin. If the metadata is missing, it might be generated by AI.
AI-generated images are becoming harder to spot. During scrolling, the brain processes visuals quickly, not critically, making it easy to miss details that reveal a fake. As technology advances, slow down, look closer and think critically.
Arryn Robbins, Assistant Professor of Psychology, University of Richmond
This article is republished from The Conversation under a Creative Commons license. Read the original article.
-
In general, I have a theoretical preference for free trade – yet I recall Moto’s explanation of Japan’s tariffs on rice. By keeping the price of rice up, small farmers in Japan kept producing rice and kept the country able to feed itself.
My thoughts go back to my most recent purchase from China. It’s a harmonica, and cost about $26 delivered. Under the new 125% tariff, the cost would be somewhere around $59. My new Kongsheng harp is a little better than my old Frontier tremolo harp – but at $59, I would have never tried it out. Even had I known it was a little better, I would have stayed with the harmonicas in the drawer.
Still, even with the tariff, it would be cheaper than a Hohner Echo harp at $90 – though I already have an Echo Harp. I just usually pack the old Frontier around because it would cost less to replace. I’m not really sure where Huang harmonicas are made – the Huang brothers once worked for Hohner, and advertise from Old Bethpage, New York.
I don’t know about my baler twine – it has a shamrock on it, but the label says nothing about country of origin. May or may not go up 125% – but the bailer has no value without twine. Parts for the Jin Ma tractor will definitely be included in the 125% tariff – but I’ve always found that, without replacement parts when you need them, a tractor can quickly become a heavy piece of yard art. I’ll probably buy twine this week, and hope to get in while the tariffs are low.
This week, I purchased a couple of boxes of replacement fittings for my gas cans – about 9 dollars delivered. All my plastic spouts had started cracking. I’m not sure that these replacements will last any longer – and the boxes are labeled ‘made in china.’
I guess, from my perspective, a tariff is a sales tax that I can possibly avoid.
-
While winter isn’t quite done with us yet, we’ve had a good period of warmth recently. Wasps, as well as bears, are waking from their winter hibernation. I’ve seen a few queen paper wasps scouting for new nesting sites.
With this in mind, if you want to control wasps in or around your property, the time to start is now. If you can catch and kill the wasp version of a queen, you’ll stop her whole colony from bothering you the rest of the summer.
(A wasp queen is called a “gyne”, which means “woman” in ancient Greek. Gynes are quite large – perhaps twice the size of a standard wasp. Gynes are the wasps most likely to not die in hibernation.)
While most paper wasps will try to hibernate through the winter (the reason we see them moving indoors in fall), most are unsuccessful. Most wasp queens have to start anew in spring, building their new colonies (and sometimes their nests) from scratch.
Raising kids can be hard work, as any parent can tell you. It’s no different for wasps. As gynes start building their new nest, and laying their first eggs of the season, they spend most of their time looking for food for their young.
(A gyne’s first eight or so children are called “haplogynes” meaning “half-women” – these are about half as large again as a standard wasp. These haplogynes take over caring for their little siblings, leaving the gyne free to lay more eggs and expand the nest.)
Developing wasp larvae, just like developing human children, need diets rich in protein to grow and build muscle tissue. As such, a gyne caring for her first batch of larvae will spend much of her time looking for meat to feed them with. Later in the year, wasp larvae will often be fed caterpillars. But early on, carrion forms much of the available meat.
If you want to control your wasp problem before it starts, consider setting a wasp trap and baiting it with a bit of leftover meat and letting it spoil. If you manage to catch and kill a gyne, or her crew of haplogynes, you’ll have won a war before giving it a chance to start.
(Bear in mind, we do live in an area with bears, who are also beginning to leave hibernation. Be bear aware, and cautious in your use of meat to bait wasp traps.)
-
Last week, we looked at a financial comparison between Trego, Fortine, and Olney-Bissell Elementary Districts, and noted the following differences in Levy amounts:
- Fortine: 73.5
- Olney-Bissell: 81.41
- Trego: 48.64
With Trego substantially lower than the other two, the obvious question is: Why?
Our first point is to compare the levied funds for all three schools- again, using the 24/25 budgets, since we won’t have 25/26 budgets until this fall.
Fund Trego Fortine Olney-Bissell General 38.28 36.95 39.34 Transportation 0.0 26.13 27.0 Bus Depreciation 8.28 7.53 0.00 Tuition 0.0 0.00 2.63 Technology 0.0 0.0 1.53 Building Reserve 2.08 2.89 10.91 There are a few things to notice here: All three schools levy fairly comparatively in their general funds. Trego and Fortine have comparable bus depreciation funds, but Olney-Bissell isn’t levying in that fund at all. Meanwhile, Trego didn’t levy in the transportation fund? Olney-Bissell levied tuition and technology when neither Trego or Fortine did, and their building reserve levy is considerably higher.
The next obvious question then: Why would a district NOT levy in a fund? There are a few potential reasons: First, it might not be a fund they can levy in without a vote. Two: The board of trustees might decide not to. Which of these funds have permissive levies? Transportation, Bus Depreciation, Tuition, and Building Reserve.
The first question our table brings up, Why didn’t Trego have a transportation levy? I can answer, because as the district clerk that set up the budget for the school board, I was involved in suggesting that course of action to the board of trustees.
Trego’s transportation budget was lowered, compared to the previous year, because it appeared there was a significant amount of it that wasn’t being spent from year to year. This extra “unreserved fund balance reappropriated” went against what would otherwise have been levied, reducing the cost to local taxpayers. The county treasurer initially thought I’d made an error.
The next question, I’ll have to speculate on. The Bus Depreciation Fund is not depreciation, per say, for anyone who uses the word in an actual accounting sense. Think of it as a savings account for the purpose of replacing school buses. There are rules about how much can be levied in this fund in any year, and the board of trustees can levy anywhere between all and none of the amount. In the case of Olney-Bissell, their allowed amount might be zero, or their board might have decided not to raise funds for school bus replacement that year in order to keep taxes lower.
Next two questions: Why did Olney-Bissell levy in tuition and technology funds? Because it could, and because it needed to in the case of the tuition fund. Levies in the tuition fund were, prior to changes in tax law, for only really specific circumstances. As for the technology fund? There’s no permissive levy there: the taxpayers voted for that one.
Final question: Why is the building reserve levy so much higher in Olney-Bissell? From the small, comparative numbers, it looks like Fortine and Trego levy only the precise amount to maximize the amount of money provided by the state for the fund. For example: Trego raised a bit over $5,000 from local taxes, but got about $12,500 from the state as a result. As for Olney-Bissell? They’ve also got voted levies funding their building reserve, in addition to the permissive levy (2.21 mills).
What can we conclude? In terms of levies that the public doesn’t get to vote on, the schools are fairly comparable, with the exception of Trego’s transportation levy. Since we know why that happened- let’s look at the previous budgets (23/24), and see how those compared.
Looking just at transportation:
Fund (23/24) Trego Fortine Olney-Bissell Transportation 2.19 28.18 22.32 Trego’s transportation levy was still weirdly low. What about 22/23?
Fund (22/23) Trego Fortine Olney-Bissel Transportation 6.44 37.0 37.84 By this point, it’s become apparent that the major difference in the levies between Trego and Fortine is predominantly caused by differences in the transportation budget. The obvious question: What is causing this difference? Next week- a closer look at elementary transportation budgets.
And, finally, a reminder: This information is public. And more than that, it’s readily available online. You can find all of these budgets and download them readily. Here’s your link. The information is available by district and year. Almost everything I’ve referenced in this article can be found within the first two pages.
-
I’ve been sick – a bit of asthma leaves me more susceptible to lung and sinus infections, and this last one has been rougher than usual. Anyway, sick or not, I decided it was a good day to replace a burned out front turn indicator light on the Talon.
The Talon is kind of my pet – 30 years old, not yet 60,000 miles, and a bit hotter than a Habanero pepper. I’ve taken it up to 145 before I ran out of nerve, and the original reviewers claimed 161 was the actual top speed (and they didn’t admit to running out of nerve). Still, over the years, I’ve learned to approach even the simplest maintenance by reading the manual first. They crowded a lot of things in some tight spaces, and the obvious way to fix things isn’t often the right way to tackle the problem.
So I look at the simple task of replacing a burned out light bulb: “12-12 15 Bulb replacement 2 If you’re replacing the right-side bulb on a 2.0 liter turbo model, remove the air cleaner (see chapter 4).” Like I said, even the simplest maintenance and repairs get a bit complicated with the Talon.
So I begin my efforts to replace a bulb by popping the hood and removing the air cleaner. Once I open it up, I find a huge mouse nest. That wouldn’t be bad, but I have a rough lung infection, and a couple days earlier I had read that Gene Hackman’s wife had died from hantavirus. Remember, I spent a few years working as a county agent, and am familiar with hantavirus. In my neighborhood, it’s spread by deer mice, and when it gets into the lungs it has a fatality rate around 40%.
Both Sam and I have traveled in the Talon before coming down with the crud. My mind goes into overdrive – if the air cleaner harbors hantavirus, what is the best way to clean things up? Could we both have hantavirus, or is this some relatively benign plague like Covid or flu?
So I pull on an old mask from the Covid panic days and a pair of blue rubber gloves – and dressed like a TSA guy, I removed the mouse nest from the air cleaner. As I take it apart, I can feel the body in there – obviously the mouse didn’t make it.
So I inspect the tiny mummy and discover that it’s a dead shrew. Identifying the shrew immediately takes the worries away – deer mice are associated with hantavirus. Shrews are not. As you can see from the nose, the two rodents are easy to tell apart:

So I have a new air filter in a clean housing. I don’t know what sort of plague and contagion hit me this time – but the dead shrew showed me it wasn’t hantavirus. I’m glad the shrew died in the air cleaner rather than somewhere where the body wasn’t available to restore my equanimity.
Want to tell us something or ask a question? Get in touch.

Recent Posts
- Computer Repair by Mussolini
- Getting Alberta Oil to Market
- Parties On Economics
- Thus Spake Zarathustra – One More Time
- Suspenders
- You Haven’t Met All The People . . .
- Play Stupid Games, Win Stupid Prizes
- The Ballad of Lenin’s Tomb
- An Encounter With a Lawnmower Thief
- County Property Taxes
- A Big Loss in 2025
- Thinking of Clovis
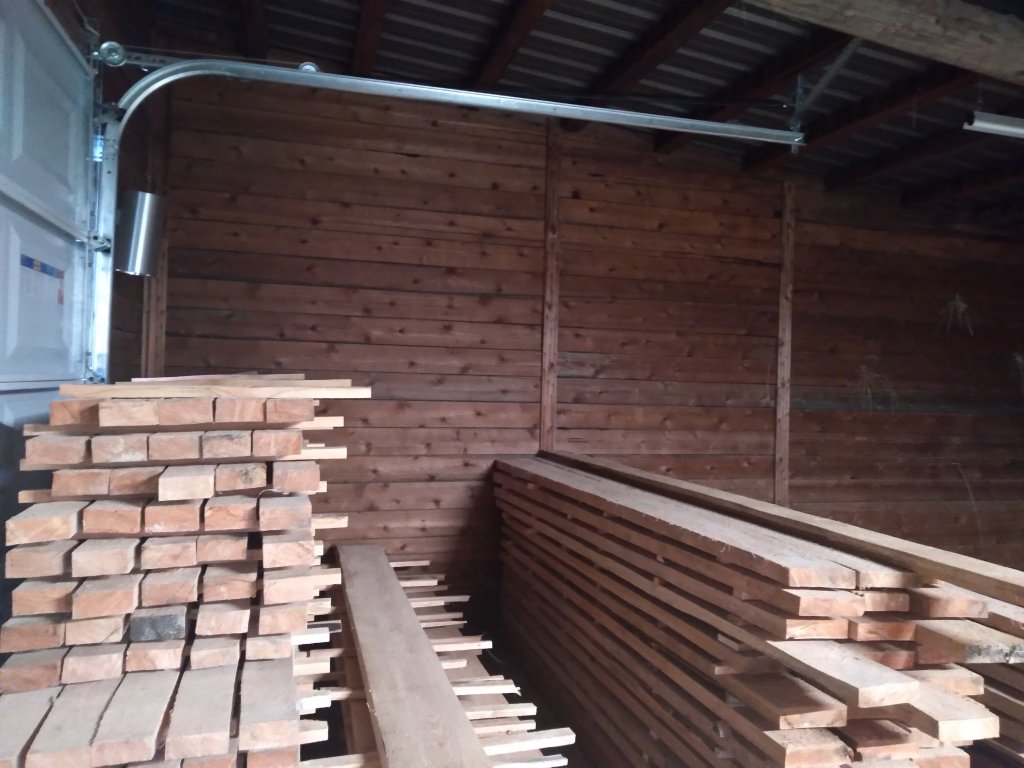
Rough Cut Lumber
Harvested as part of thinning to reduce fire danger.
$0.75 per board foot.
Call Mike (406-882-4835) or Sam (406-882-4597)
Popular Posts
Ask The Entomologist Bears Books Canada Census Community Decay Covid Covid-19 Data Deer Demography Education Elections Eureka Montana family Firearms Game Cameras Geese Government Guns History Inflation life Lincoln County Board of Health Lincoln County MT Lincoln Electric Cooperative Montana nature News Patches' Pieces Pest Control Politics Pond Recipe School School Board Snow Taxes travel Trego Trego Montana Trego School Weather Wildlife writing
