-
HB 408 created the Innovative Education Program Tax Credit which “is available to taxpayers who donate to Montana public school districts (PSD) for the purpose of providing supplemental funding to the school districts for innovative educational programs (IEC).”
Montana’s 2023 tax rates ran from 1% to 6 ¾ % (kicking in at $21,6010), so it isn’t particularly hard to find people who could make a thousand or two contribution to the school, then get it back come tax time. The new law creates a way to increase school funding with individual donations instead of trying to pass another levy. Like the headline says – we need better school board member, teachers and administrators to take advantage of this opportunity. The challenge here is that the law limits these donations to 5 million per year – which kind of says the schools that already have boards, teachers and administrators who think outside the box are going to get this new source of funding.
Schools that lack folks with that sort of thinking are going to get what the littlest pig got.
School districts have to register for an account on the Education Donation Portal to accept donations eligible for the tax credits.
Innovative Educational Programs are defined as “an advanced academic program that enhances the curriculum or academic program of an eligible public school. They can include:
- Transformational learning (20-7-1602 MCA)
- Advanced Opportunity (20-7-1503 MCA)
- Any program, service, instructional methodology, or adaptive equipment used to expand opportunity for a child with a disability (20-7-401 MCA)
- Any courses provided through work-based learning partnerships for post secondary credit or career certification
- Technology enhancements
- Capital improvements and equipment necessary to support innovative educational programs
More data is available from the folks at Montana Department of Revenue: 406-444-6900.
-
If I put my hand on a hot stove, I’m going to pull it back quickly. Since I have a wood stove that burns half the year, I have the occasional reminder that I need to be a bit more cautious. The psychology folks call it stimulus response.
Generally speaking inflation comes from printing more money. Not always – the Spaniards kept importing gold from the American Indians, and inflated their currency. I think the Nevada silver mines inflated European currencies that were based on silver. But that’s history – now we inflate currency by printing more and more of it.

It’s the problem with Bidenomics – first they printed more money, then when they saw it was causing inflation, they picked printing more money as a solution to the problem. As a general rule, it takes 3 elections to teach a politician anything. As the above chart shows – there are about the same number of hundred dollar bills in circulation as ones. Thing is, they don’t circulate as fast (20 year life expectancy compared to 6 or 7 years for the dollar bills).

The chart above shows where the dollar has been devalued by inflationary printing – the Bretton Woods agreement (just above George Washington’s left eye) established the US dollar as the world’s reserve currency, and did reduce our vulnerability to inflation – but you can see where Nixon abandoned the gold standard. BRICS – a consortium composed of Brazil, Russia, India, China and South Africa have been working at developing an alternative to the US dollar for international trade. That has been unsuccessful, largely because their politicians are seen as worse than ours.
-
April’s eclipse will mean interruptions in solar power generation, which could strain electrical grids
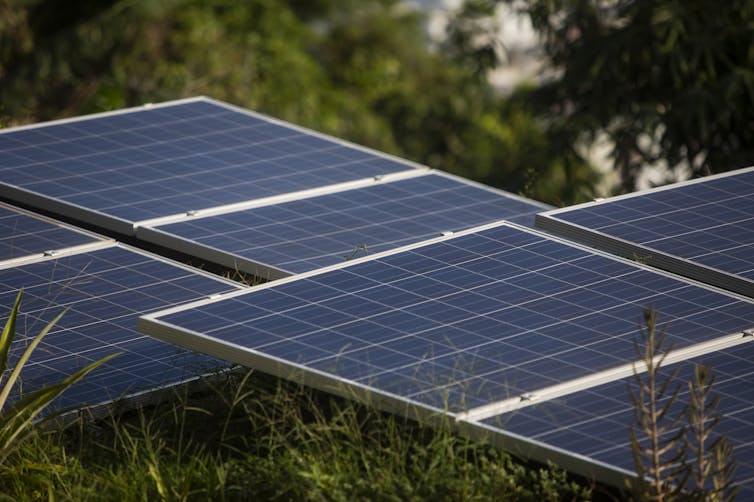
Solar panels in Brazil. AP Photo/Bruna Prado Vahe Peroomian, USC Dornsife College of Letters, Arts and Sciences
During the most recent total solar eclipse visible in the U.S., on Aug. 21, 2017, the skies darkened as the Moon crossed in front of the Sun. It blocked out all sunlight – except for that from a golden ring visible around the Moon’s shape, called the corona. Not surprisingly, solar power generation across North America plummeted for several hours, from the first moment the Moon began to obscure the Sun to when the Sun’s disk was clear again.
On April 8, 2024, another total solar eclipse will track across the U.S., causing perhaps an even greater loss of solar power generation. Although this will be the second total solar eclipse visible in the U.S. in under seven years, these events are a rare occurrence. Nevertheless, they present a unique challenge to power grid operators.
I am a space scientist with a passion for teaching physics and astronomy. Though I have seen many partial eclipses of the Sun, I have yet to witness a total solar eclipse. My road trip to Bryce Canyon National Park in Utah in October 2023 to see the “ring of fire” annular solar eclipse was unforgettable, and April 8 will surely find me handing out eclipse glasses once again.
When the Moon’s shadow blocks the Sun
During a solar eclipse, the Moon partially or completely blocks the view of the Sun. Since the Moon is nearly 400 times smaller than the Sun and nearly 400 times closer, the Moon’s shadow, visible from Earth, tapers to a width of 70 to 100 miles (112 to 161 kilometers).
Within this region, called the path of totality, observers see a total solar eclipse. Observers close to but outside this path witness a partial eclipse of the Sun, where the Moon covers a fraction of the Sun’s disk.
During the April 8, 2024, total solar eclipse, the path of totality in the continental U.S. will extend from Texas in the south to Maine in the northeast. Elsewhere in the U.S., Miami will see a partial eclipse in which a maximum of 46% of the Sun’s disk is obscured. In Seattle, far from the path of totality, the Moon will cover only a maximum of 20% of the Sun. In southern Texas, where the path of totality first crosses into the U.S., the eclipse will last just under three hours, with totality a mere 4 minutes and 27 seconds.
Increasing reliance on solar power
The worldwide trend toward renewable energy has seen a significant increase in solar, or photovoltaic, power generation in the last decade. Solar power generation capacity is set to double worldwide between 2022 and 2028, and the U.S. now has the capacity to generate three times more solar energy than at the time of the 2017 total solar eclipse.
The most obvious obstacle to solar power generation is cloud cover. On a cloudy day, the energy produced by solar panels drops to 10% to 25% of its output on a sunny day.
The North American power transmission grid is divided into six major regions and more than 150 local and regional subgrids. Electrical system operators in each local grid continuously balance the amount of electricity production with the “load,” or the demand for electricity by consumers.
System operators can tap into energy from various power generation mechanisms like solar, wind, hydroelectric, natural gas and coal. Local grids can also import and export electricity to and from their grid as needed.
System operators have accurate models for the amount of solar power generated across the U.S. on a daily basis, and these models account for the parts of the continental U.S. that may have cloudy skies. By pairing solar power generation with battery storage, they can access electricity from solar even when the Sun isn’t shining – on cloudy days or at night.
To plan for an eclipse, electrical system operators need to figure out how much the energy production will drop and how much power people will draw from the reserves. On the day of the 2017 total solar eclipse, for example, solar power generation in the U.S. dropped 25% below average.
Because solar power production falls quickly during the eclipse’s peak, grid operators may need to tap into reserves at a rate that may strain the electrical transmission lines. To try to keep things running smoothly, grid operators will rely on local reserves and minimize power transfer between grids during the event. This should lessen the burden on transmission lines in local grids and prevent temporary blackouts.
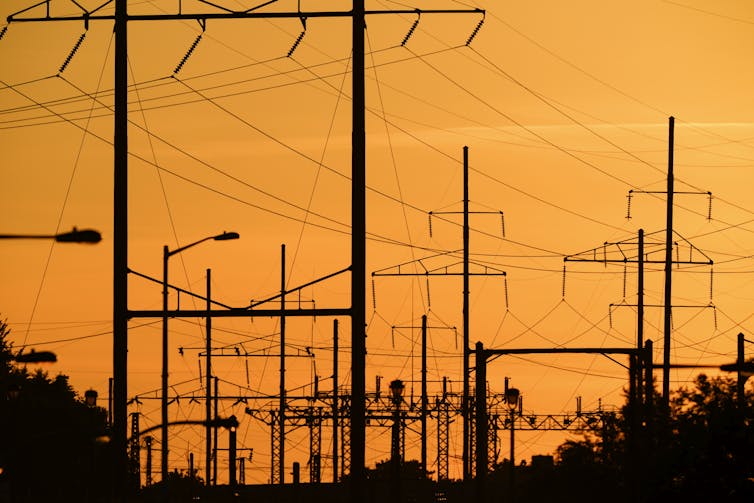
Solar eclipses can stress the power grid. AP Photo/Matt Rourke Renewable energy during eclipses
Solar isn’t the only type of renewable energy generation that goes down during an eclipse. Since it’s not as sunny, temperatures along the path of the eclipse fall by as much as 10 degrees Fahrenheit (5.5 degrees Celsius). Lower temperatures lead to slower wind speeds and less wind power generation.
During the August 2017 eclipse, the loss of renewable power generation added up to nearly 6 gigawatts. That’s equivalent to the energy usage of 600 million LED lightbulbs or 4.5 million homes.
Grid operators compensated by planning ahead and increasing power generation at natural gas and coal-powered plants, which don’t depend on sunlight.
Over the duration of the eclipse, this increase in nonrenewable energy use led to approximately 10 million pounds of extra carbon dioxide emissions. That’s about the annual carbon dioxide emissions of 1,000 cars.
On April 8, eyes across the U.S. will turn upward to catch a glimpse of the eclipsed Sun.
Thanks to the vigilance of electric grid operators, the lights should stay on, and observers won’t have to worry about anything but the stunning show in the sky.
Vahe Peroomian, Professor of Physics and Astronomy, USC Dornsife College of Letters, Arts and Sciences
This article is republished from The Conversation under a Creative Commons license. Read the original article.
-
I ran across this statement on the blog “Small Dead Animals”: “Concentrated minority interests will ALWAYS defeat dispersed collective majority interests in any system of government/institution that doesn’t terminate in an individual owner.” It referenced a substack article at Short Take: Public Choice Theory and How This Ends The article is an interesting read – but supplementing it with What Is Public Choice Theory? is probably a good idea.
“In his 1957 book Economic Theory of Democracy, American economist and expert in public policy and public administration Anthony Downs, established that one of the chief underpinnings of public choice theory is the lack of incentives for voters to monitor government effectively. According to Downs, the typical voter is largely ignorant of political issues, and this ignorance is rational. Even though the result of an election may be very important, an individual’s vote rarely decides the election. Since individual voters are aware that they have virtually no chance to determine the outcome of the election, they see no value in spending time following the issues.”
Downs makes sense – his explanation shows how the voter becomes alienated from the process. It’s why lobbying works – you can spend money to influence politicians on a narrow issue where you can’t influence the public.
The substack article addressed homelessness – Kulak points out the “Social Worker Complex” that profits from the situation. I’m an Aggie – I look at the corn diverted to ethanol production to add to my gasoline. I think back at how increasing regulation of the dairy industries crowded small producers out of business. I think of tobacco allotments. The term “concentrated minority interests” does cover the topic. The ThoughtCo article describes our system:
“More recently, however, public choice experts have adopted a “congressional dominance” model of bureaucracy. In this model, government agencies and their bureaucrats are not free to pursue their own agendas. Instead, agency policy preferences mirror those of the members of key congressional committees that oversee particular areas of public policy, such as agriculture, nutrition, and housing. These oversight committees constrain bureaucratic discretion by exercising their powers to confirm top-level political appointees to senior agency positions, finalize annual bureau budget requests, and hold public hearings.”
The Economic Research Service classifies rural counties based on economic and policy types. We’ve gone from being a natural resources dependent economy to being a mix of recreation, retirement and government employment. Rural areas that become increasingly recreational tend to crowd the natives out. It’s public choice – though the residents who are crowded out might not feel that it’s their choice.
I recall an old man outside Libby about 25 years ago. He had worked the woods and the mill, building a very nice house on the river. His retirement income was not high – but his property value and taxes were. He had asked me to check his math, and there was nothing wrong with the old man’s math. When I affirmed his calculations, he described his decision – to sell his house, and move to Chester. The cost of becoming a recreation county is paid by folks who find they can’t afford to stay.
Kulak thinks the solution is to convert Washington DC to a wasteland. On the other hand, the ThoughtCo article offers this solution:
“Niskanen holds that to raise the performance of public bureaucracy, the remedy must be increasingly found in terms of private markets where the structure and incentive system exist specifically for the supply of public services. As a result, suggests Niskanen, the monopoly of the bureaucracy must be reduced by exploring privatization—the use of private-sector sources to supply public services.”
Both articles are worth reading – Public Choice Theory offers too many explanations for what is occurring in our neighborhood.
-
I ran across an article by Nate Silver Biden’s problem is with swing voters, not with his base the other day. A couple of facts that I picked out seem to differ with the headline:
One, from a Matthew Iglesias quote is that “Trump is winning 97% of those who voted for him 4 years ago . . . Biden is winning only 83% of his 2020 voters with 10% saying they now back Mr. Trump.”
It’s quite a poll result – asking a slightly different question and getting an entirely different answer. I remember that it just turned March, and that I expect a lot of change between March and November – there is an entire gardening season to go through. I have a grandson who is just beginning to walk in March – I expect proficiency by November. Yet that different question sticks in my mind.
Another of Silver’s observations dealt with our political party loyalty –
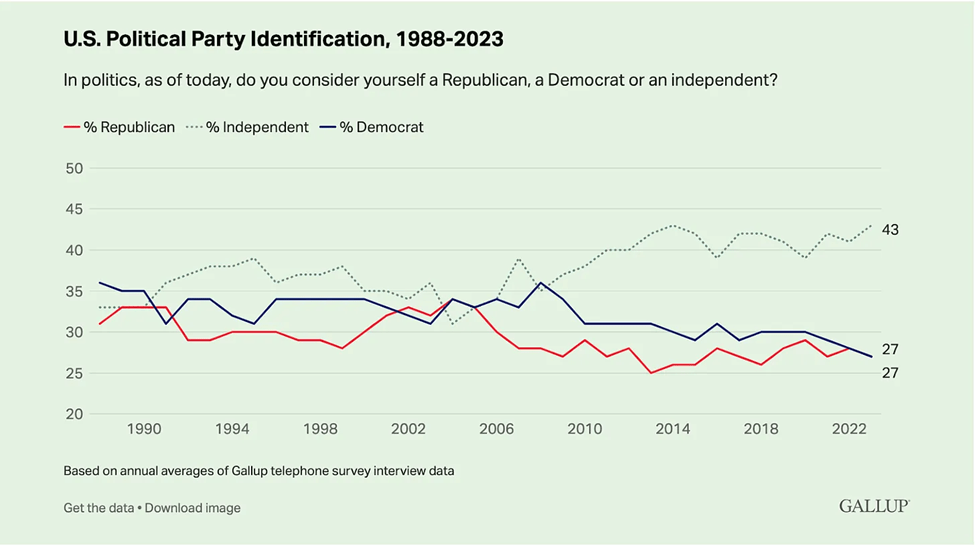
We’re at a point where only 27% of Americans identify as Democrat, another 27% as Republican, and 43% as independent. I’m not a good enough pollster to be telling Gallup the questions to ask – but I am interested in the decline of party identification. Can it be that we’re watching each machine shaft us and beginning to despise both parties? Perhaps we need a different question: “How poorly does the Democrat/Republican party represent you?” Millard Fillmore was the last Whig party president – and we may be looking at a need to develop two new parties.
Of course, the presidential election can change with the party conventions in July and August. I anticipate the Republicans will stay with Trump – but the Democrat National Convention has turned into a Convulsion before. Click the link, and read Nate Silver.
-
One of the ‘Things Our Government Has Been Up To’ is House Bill HB203, which passed into law. It’s marketed as a bill about school choice, although Montana was already a state that allowed for out of district enrollments.
One of the things it does, is that it makes it harder for schools to say no to out of district enrollment. “Perhaps the most compelling and direct impact of HB203 is that Montana public school districts will no longer have absolute discretion to deny applications for out-of-district attendance.” There are very limited circumstances in which the law will allow districts to reject out of district enrollment.
More choice for parents? Not here. Our local schools have already been accepting out of district enrollments when they’ve been able to do so and meet the needs of the students. Less choice for school boards? Definitely. And for taxpayers…?
The taxpayers of the district accepting students aren’t on the hook for funding those students (and really weren’t before, since the state distributes school funding based on enrollment anyway), but the donating school district can expect to contribute over a thousand dollars of tuition per leaving student.
Will this impact district taxes and levies? Probably, especially in smaller districts where budgets run tight.
Did it increase our choices for where to send our kids to school? No. Not here. Not for us. Did it turn our kids into dollar signs for other school districts? They already were, do to the state’s method of redistributing funds. But it’s increased the number that goes with the dollar sign.
What did our local senator and representative vote? Yea.
-
The Eureka Community Players announces auditions for their annual Spring play held during the Eureka Rendezvous weekend. Following the tradition of doing a melodrama, the Players have selected “Belle of the Ball” ahigh-kicking western melodrama! The play will be presented on April 26-28 at the Timbers Event Center.
“Belle of the Ball” is a combination of the fairy tales of Cinderella and Snow White, lassoed together in a melodrama format. Will good win out or will evil prevail? Many twists and turns ensue, including a romp through the audience, before we know. A fun show for the whole family.
The Players are also looking for musicians who would like to perform during intermission.
Auditions are scheduled for March 16th at 6:00 p.m. and the Timbers Event Center. Actors do not need to prepare anything for the auditions but come prepared to read from the script. There are parts for three men and seven women, a variety of ages.
For more information about auditions, call John LaBonty at 406 / 230-0592.
-
Commentary – New Book on Rural America Started with a False Conclusion, Then Looked for Evidence
by Nicholas F. Jacobs, The Daily Yonder
March 6, 2024A new book on “white rural rage” argues that rural Americans are the most racist, xenophobic, conspiracist, anti-democratic, and violent “geodemographic” subgroup of Americans out there. The authors, Tom Schaller and Paul Waldman, say that their book is driven by data and that even if you don’t like their conclusions the evidence is clear. The problem with this book is not a lack of citations; they “bring the receipts,” as they like to boast. The problem is that those receipts belong in the trash.
Scholars have repeatedly shown that there is a difference between rural and urban voters, and it’s not rage, racism, or homophobia. But before I explain more about that rural difference, let’s look at the many ways Schaller and Waldman misuse data to support their claim that rural Americans are the nation’s biggest threat to democracy.
A Salacious Title in Search of Facts
I’ve reviewed every publicly available survey and poll they use to stereotype, marginalize, and ultimately demean the lives and beliefs of rural Americans. The book reeks of tell-tale signs of being written first and finding facts second. Only after they settled on a salacious title, it seems, did they go out and try to find what they already agreed to see, with little to no attention paid to whether any of it was true. Although they are sure to sell books, their selective use of sketchy data will worsen our efforts to rebuild rural communities and close a rural-urban divide that threatens our democracy, regardless of where you live.
This is not normal academic quibbling about numbers and definitions. The faults I describe below lead the authors to drastically different conclusions that more rigorously conducted research demonstrates. Where rural politics scholars are increasingly attentive to the idea that “rage” is not the same as economic anxiety, community pride, and a sense of place, Schaller and Waldman simply want us to write off rural America as the land of radical extremism. By the time they even get to some warm-hearted conclusion on empowering rural community, they’ve so misrepresented and maligned rural people that nobody in the countryside can (or should) trust them, and nobody inside urban America will find it worthwhile to care about some wasteland of hate.
Below I detail the four most significant problems with the underlying data presented throughout the book. I offer a more comprehensive list of each survey and poll they use here, and briefly describe my concerns below.
A Litany of Problems
The first problem is that the vast majority of data lacks any consistent definition of what they mean by the word “rural.” This hole gives the authors license to pick and choose various points from whatever surveys they want with no regard for what those studies say about rural people – if, in fact, the studies care to define rural in the first place.
Consider, as just one of several examples, a method by the polling firm IPSOS, which informs work from the Public Religion Research Institute (PRRI) that Schaller and Waldman use to prove that rural folks are distinctively drawn to QAnon conspiracies. IPSOS defines rural as any resident living in a county that is not a part of any Metropolitan Statistical Area (a place with a dense urban center of 50,000 people or more). The Census, however, estimates that 54% of all rural people actually live inside those “metropolitan” areas — areas excluded by the IPSOS definition. Consequently, this result about “rural America” is drawn from a survey that excludes a majority of rural residents. One wonders if the authors cared to think about what this actually means for their results, or if the headline grabbing “finding” is all that mattered.
Second, even if we were to have a consistent definition, Schaller and Waldman seem to willfully neglect any concern over sample sizes. More often than not, the surveys that inform this “data-driven” account simply do not get enough respondents who are even from rural areas, however defined. Yes, survey outlets will report out what “rural” individuals said, but a closer look shows that those rural estimates often draw on just a few hundred people. Small sample size introduces increasing amounts of uncertainty and error. The smaller the sample, the larger the margin of error. When these margins get too big, it’s impossible to use the answers with any statistical certainty.
Consider a poll by the Institute of Politics, which Waldman and Schaller reference to show that rural Americans are the most likely to “take up arms against the government.” That claim depends on just 220 rural residents and 290 city residents. As such, if 35% of rural residents agree, and 29% of city residents agree, probabilistically they are indistinguishable from one another.

Related Story
Or consider another poll by Marist University, which Schaller and Waldman say proves the point that rural residents are more likely to believe in nonexistent voter fraud. That conclusion depends on a grand total of 167 rural individuals. Not only are the margins of error too big to be meaningful, you might wonder, can you even get a representative portrayal of rural America with that many people.
No. And that’s the third problem. Because most surveys are done to get a representative picture of the national population, even when they do have adequate sample sizes, seldom do the rural respondents in the poll actually represent the demographics of rural America.
Two of the most egregious cases in the book are when the authors rely on a poll of just two states to make claims about birtherism in rural America and when they present a survey of residents in just nine states, which collectively represent just 31% of the rural American population.
Samples That Don’t Reflect Rural Demographics
In the last seven years, I’ve surveyed over 25,000 rural residents. My experience is that the first to respond and fill that “rural” quota are older and more conservative than average. Getting young rural folks is hard, and most surveys might only have a handful. Alas, the vast majority of studies Schaller and Waldman cite do not report out demographic statistics on their rural populations. Did they even care if they represented “rural” communities?
This demographic imbalance exists even in high-quality surveys, because most surveys are designed to make claims about the national population. Surveys weights are therefore used to adjust samples to mirror national demographic patterns. In the case of the American National Election Study, for example, this means that any estimate about rural residents inflates the voices of the most elderly residents (65+), because ANES weights create an incorrect demographic snapshot of rural America, with 30% more elderly residents than what the U.S. Census says should exist.
Only two surveys in the entire book conform to basic standards of survey research and even attempt to try and present an accurate picture of rural America: a 2017 study from The Washington Post and Kaiser Family Foundation (1,070 rural residents) and a 2018 report from the Pew Research Center (2,085 rural residents) — a study, by the way, that shows that majorities of rural Americans believe that “white people benefit from advantages in society that black people do not have,” that “there are still significant obstacles that make it harder for women to get ahead than men,” that there are, indeed, “situations in which abortion should be allowed,” and who reject the idea that a non-white, majority country would be “bad” for America. Oh, the rage!
Of course, not even these are perfect. Because it focuses on rural communities, the WAPO/KFF study only includes 303 urban and 307 suburban respondents – small samples. Consider what this means when interpreting who thinks that “immigrants today strengthen our country,” one of the questions Schaller and Waldman use to show just how xenophobic rural people allegedly are. Once you account for the margin of error (which Schaller and Waldman never report once in the book), rural residents actually believe the same thing as suburban residents; indeed, one question down (remember cherry-picking?), the survey shows that rural residents are just as likely as urban residents to say that “most immigrants coming to the U.S. in the last 10 years are doing enough to adapt to the American way of life.” Can you find the rural rage?
What’s Rural Got to Do with It?
The final problem is the worst one because it exists even if you account for problems of defining rurality and getting large, representative samples. Throughout the book, Schaller and Waldman solely rely on group comparisons – a true indication that their analysis is driven more by a desire to confirm one’s beliefs than to find real evidence for “rural rage.” Nowhere in this book is there any attempt to understand what motivates rural people, in particular, to think one thing or another. Are these really rural problems, or are they the product of some other demographic characteristic such as age, race, or gender? Is the “rage” supposedly felt in rural areas really different than elsewhere? We just cannot tell from group averages alone.
Schaller and Waldman, for instance, are concerned about the rise of QAnon conspiracy theory beliefs. I am too. Using the 2021 American Values Survey from PRRI (the same one that excludes majority of rural respondents), they rest their claims of rural rage on the fact that 24% of rural residents are QAnon believers. The rage is there, they say, because that is disproportionately higher than the 17% of Americans who are rural, as estimated by PRRI (it is possible these are statistically the same, but data to compute the margin of error is not disclosed). Nevertheless, the problem is that, from this simple comparison alone, they conclude that rural is extreme; rural is the hotbed of QAnon; rural is danger land. But the vast majority of rural residents don’t believe in QAnon conspiracies. And there are over three times as many QAnon believers outside rural America. That makes rural America the threat to American democracy?
Consider the same fallacy as it relates to something like vaccine uptake. Black Americans are the least likely to have had a Covid vaccine. Whatever the reason for this phenomenon, no one would jump from that finding to say “the real threat to public health comes from Black Americans’ refusal to take the vaccine. They are the least likely group to get it.” We know that claim is nonsense because unvaccinated Black Americans represent such a small percent of the unvaccinated population (just like rural!). Moreover, low vaccine rates might actually have little to do with race per se, but instead be the consequence of other factors we know are associated with vaccine uptake and race — maybe income or education? If we actually cared about increasing vaccine uptake (or fighting conspiracy theory), we wouldn’t give a second thought to such a shoddy argument.
Instead, the way we would really test why certain groups behave a certain way – be it conspiracies or vaccines — is to compare individuals within and between those groups so that we can account for the multiple differences that they might have in common. Schaller and Waldman themselves never dig this deep, keeping the analysis simplistic and shallow.
But I got some of their data and did the work. Using the individual-level data provided by the 2018 Pew study, for example, I tested Schaller and Waldman’s claims that rural residents are distinctively “xenophobic.” At a group level, 57% (+/- 1.1) of rural residents compared to 35 % (+/- 0.68) of urbanites, agree that a “growing number of newcomers from other countries threatens traditional American customs and values.”
I relied on widely used and understood tools of statistical inference (i.e., a regression model) to understand what best explains a person’s response to that question. Ruralness? Maybe. But maybe they answer that way because of age, sex, level of education, party identification, income, race, some religious beliefs, or all of the above.
Here’s the model’s results. Bottom line: when we include those characteristics in a model that also accounts for where someone lives, geographic differences disappear. Rural residents are statistically no more likely to think “xenophobic” beliefs on account of their rurality. Attitudes here are almost entirely attributable to partisan identity. Being rural adds nothing to the explanation. It is statistically meaningless, because what drives those group averages is solely a function of Republican partisan identity. That is, rural residents are thinking the same way about that issue as urban and suburban residents. You may disagree with that thought, but your disagreement is with Republicans, not rural people. And if the goal of White Rural Rage is to say that the threat to American democracy is emanating from the heartland, the data just do not support that idea.
What Is the “Rural Difference”?
Schaller and Waldman might come back and say that that is a difference without a distinction. Because rural residents have some disproportionate weight at the ballot box, their group level influence is what reverberates throughout American democracy.
But I thought the goal was to understand motivations. Why do rural residents hold these beliefs? Why are they so enraged? What makes them, as a group, more likely to vote for someone like Donald Trump? Motivations explain why people are drawn to some candidates and not others. Motivations are how we build new coalitions and encourage candidates to speak to the issues that are driving illiberalism. Motivations are the thing we have to study if we truly care about the threat to democracy rather than book sales.
Scholars, again, and again, and again, however, have shown that there is something distinct about rural people’s motivations, and it isn’t rage. In my latest book with Dan Shea, we rely on genuinely representative samples of 10,000 rural Americans. And, actually driven by the data and concerned with its quality, we find that there is a distinctive reason why so many rural residents find Trump appealing and have moved towards the Republican Party. They feel unheard. They worry about the future of their community and their kids having to move away. They do so much with so little and they resent it when someone from outside their community steps in and pretends to know what they think (especially when they pretend to have the facts). Far from the stereotypes you find in White Rural Rage, we find that rural folks are overwhelmingly proud of their communities, but feel that elites look down on them, stereotype their cherished ways of living, typecast them in broad strokes – simply put, see nothing, but rural rage.
Nicholas F. Jacobs is an assistant professor of government at Colby College and the co-author, with Daniel M. Shea, of The Rural Voter: The Politics of Place and the Disuniting of America.
This article first appeared on The Daily Yonder and is republished here under a Creative Commons license.

-
Who needs the consumer price index when you can watch headlines? Speaking of the consumer price index, the Feds are claiming only modest increases. The Misery Index is running about 6.8 this year, ostensibly lower than the last few years.
A Sampling of Headlines:
- Wall Street Journal: To Save Money, Maybe You Should Skip Breakfast (Roughly a Year Ago)
- The New York Times: How Child Care in New York City Became Unaffordable for Nearly Everyone (Roughly 7 months ago)
- USA Today: When just one job isn’t enough: Why are a growing number of Americans taking on multiple gigs? (Roughly 5 months ago)
- Today: Kellogg CEO faces backlash for suggesting people eat ‘cereal for dinner’ to save money (Last Month)
- Yahoo Finance: 7 Things the Middle Class Won’t Be Able To Afford in the Next 5 Years (Last Week)
- KBZK News: Bozeman median home prices approaching $1 million (This Week)
- Newsweek: Gen Z Are Having Parents Pay for Rent (This Week)
Somehow, the more direct news about the economy (New York Times: US Adds 275,000 Jobs in February as Growth Remains Strong) just isn’t all that reassuring.
-
Heaven and Hell are both dictatorships. The difference is in the management. Back in 1787, Benjamin Franklin announced that our form of government would be “A republic, if you can keep it.” So far, management of that republic has been somewhere between the management level of Heaven and Hell. Maybe it’s structurally set up to be in the middle of the road.
Somehow, we wound up with a two-party system – George Washington and John Adams were both Federalists. We don’t have Federalists any more. Then Thomas Jefferson came in as a Democratic-Republican – we have both of those now, but I doubt if Tom would recognize either group as his moral descendents. It stayed with Democratic Republicans through Madison and Monroe – then John Quincy Adams came in as a National Republican. John Quincy was in second place to Andy Jackson – but when Congress was through with the election, John Quincy Adams was President. Once.
Andy Jackson ran again as a Democrat and won. He was followed by a one-term Democrat named Van Buren, and then the Whigs came in with Harrison and Tyler. Harrison died after a month in office, Tyler finished his term, then Polk was a Democrat elected for one term, followed by Whigs Zachary Taylor and Millard Fillmore (who finished that term). It may be worth noticing that John Quincy Adams left the National Republican party to join the Anti Masonic party, and that Millard Fillmore became a Whig when the Anti Masonic party died before his political career did.
Democrats Franklin Pierce and James Buchanan were single-term Democrats, then Lincoln came in and it’s been Democrats and Republicans ever since. Obviously, we haven’t been long-term, permanently happy with either side in over a century of experimentation. Perhaps Frank Herbert had it right:

If power is indeed a magnet for the corruptible – and I can imagine folks nodding agreement with that phrase and mental images of Trump and Biden – we have a problem.
On one hand, I’m looking at an election where I don’t particularly want either candidate. On the other hand, I’m looking at candidates that are about as opposite each other as can be. Unfortunately, we’re not offered the choice between heaven and hell.

Want to tell us something or ask a question? Get in touch.

Recent Posts
- When Castro Was Cool
- You Have To Beat Darwin Every Day
- Computer Repair by Mussolini
- Getting Alberta Oil to Market
- Parties On Economics
- Thus Spake Zarathustra – One More Time
- Suspenders
- You Haven’t Met All The People . . .
- Play Stupid Games, Win Stupid Prizes
- The Ballad of Lenin’s Tomb
- An Encounter With a Lawnmower Thief
- County Property Taxes

Rough Cut Lumber
Harvested as part of thinning to reduce fire danger.
$0.75 per board foot.
Call Mike (406-882-4835) or Sam (406-882-4597)
Popular Posts
Ask The Entomologist Bears Books Canada Census Community Decay Covid Covid-19 Data Deer Demography Education Elections Eureka Montana family Firearms Game Cameras Geese Government Guns History Inflation life Lincoln County Board of Health Lincoln County MT Lincoln Electric Cooperative Montana nature News Patches' Pieces Pest Control Politics Pond Recipe School School Board Snow Taxes travel Trego Trego Montana Trego School Weather Wildlife writing
