-
Earth may have had all the elements needed for life within it all along − contrary to theories that these elements came from meteorites

Scientists still debate the origins of Earth’s life-sustaining elements. BlackJack3D/E+ via Getty Images Shichun Huang, University of Tennessee and Wenzhong Wang, University of Science and Technology of China
For many years, scientists have predicted that many of the elements that are crucial ingredients for life, like sulfur and nitrogen, first came to Earth when asteroid-type objects carrying them crashed into our planet’s surface.
But new research published by our team in Science Advances suggests that many of these elements, called volatiles, may have existed in the Earth from the beginning, while it formed into a planet.
Volatiles evaporate more readily than other elements. Common examples include carbon, hydrogen and nitrogen, though our research focused on a group called chalcogens. Sulfur, selenium and tellurium are all chalcogens.
Understanding how these volatile elements made it to Earth helps planetary scientists like us better understand Earth’s geologic history, and it could teach us more about the habitability of terrestrial planets beyond Earth.
Why it matters
The popular “late veneer” theory predicts that Earth first formed from materials that are low in volatiles. After the formation of the Earth’s core, the theory says, the planet got volatiles when volatile-rich bodies from the outer solar system hit the surface.
These objects brought around a half a percent of Earth’s mass. If the late veneer theory is right, then most elements that make up life arrived on Earth sometime after the Earth’s core had formed.
But our new research suggests that Earth had all its life-essential volatile elements from the very beginning, during the planet’s formation. These results challenge the late veneer theory and are consistent with another study tracing the origin of water on Earth.
How we did our work
To study the origin of volatiles in the Earth, we used a computational technique called first-principles calculation. This technique describes the behaviors of isotopes, which are atoms of an element that have varying numbers of neutrons. You can think of an element as a family – every atom has the same number of protons, but different isotope cousins have different numbers of neutrons. https://www.youtube.com/embed/42gUZNYco0c?wmode=transparent&start=0 Isotopes have a host of useful applications, from archaeology and medicine to planetary science.
Different isotopes behaved slightly differently during each stage of Earth’s formation. And the isotopes left behind a signature after each formation stage that scientists can use as a kind of fingerprint to track where they were throughout Earth’s formation.
First-principles calculation allowed us to calculate what isotope signatures we’d expect to see for different chalcogens, depending on how the Earth formed. We ran a few models and compared our isotope predictions for each model with the actual measurements of chalcogen isotopes on Earth.
We found that while many volatiles evaporated during Earth’s formation, when it was hot and glowing, many more are still left over today. Our findings suggest that most of the volatiles on Earth now are likely left over from the early stage of Earth’s formation.
What’s next
While chalcogens are interesting to study, future research should look at other critical-for-life volatiles, like nitrogen. And more research into how these volatiles behave under extreme conditions could help us know more about how isotopes were behaving during each of the growth stages of Earth’s formation.
We also hope to use this approach to see whether some exoplanets – planets beyond our solar system – could be habitable to life.
The Research Brief is a short take about interesting academic work.
Shichun Huang, Associate Professor of Earth and Planetary Sciences, University of Tennessee and Wenzhong Wang, Professor of Planetary Science, University of Science and Technology of China
This article is republished from The Conversation under a Creative Commons license. Read the original article.
-
I ran across an article that was comparing Connecticut and Oklahoma and concluded that longer life spans were associated with progressive or liberal political systems. Naturally, I thought of other things that might explain the difference – Oklahoma’s population has more Native Americans, and that also correlates with more diabetes. The lowest life expectancy is Mississippi – which also has the highest percentage of obesity. There are things associated with life expectancy more closely than political systems.
Montana, as I recall, has a much higher rate of traffic fatalities than most states. I can look the numbers up, but most of my neighbors will automatically know the answer – we have more high speed accidents in remote areas. Compare our rates with Rhode Island – the populations are about the same, but the longest dimension of Rhode Island is 48 miles – and it has 11 hospitals. When your wrecks happen at 30 mph, and hospitals are 5 or 6 miles apart, you can expect lower traffic fatalities.
If you’re interested in comparing specific states, the life expectancy tables are at Life Expectancy by State 2023 The Center for Disease Control page is at Life Expectancy at Birth by State, if you prefer their take. -
I’m reading Donald Hamilton’s novels about Matt Helm – again. Frankly, I found Matt a more real character than James Bond – but my taste isn’t always mainstream. Ian Fleming wrote James Bond, and when they turned the paperbacks into movies, got Sean Connery. Hamilton wrote Matt Helm, and got Dean Martin to play the role of 6’4” Swedish-American Matt Helm. Dean just wasn’t a convincing 6’4” Swede. Then when the Manson family murdered Dean’s co-star, Sharon Tate, it kind of wiped Matt Helm off the silver screen.
Each James Bond movie that came out meant more printings and royalties for Fleming. Hamilton didn’t get loads of printings – one big printing, and then folks had to wait for the next novel. I had no idea that there were 27 Matt Helm novels . . . now 28 if you include the fan-fic Matt Helm: The War Years. And someone decided to bring Matt back into print about ten years ago.
There’s a different world for these adventure/spy novels now than there was in the sixties and seventies – I look at The Retaliators, with a copyright date of 1976. I probably bought the copy I first read at Rosauers in Libby while basing out of a motel for snow surveys. The Infiltrators, printed in June, 1984 was a book I missed, living in towns without any sort of bookstore. Now, I can get on Alibris, and find most of the Matt Helm series (though the cheapest copy offered of The Ravagers is $61.50. The really helpful thing is they started second printings of most of the series about ten years back, so a lot of the books are in pretty good shape.
So, if you missed Matt Helm – and the series was pretty easy to miss compared to James Bond – here are a few Matt Helm quotes to show what was on supermarket book shelves in the 60’s and 70’s:
“The fact is there are people with a vested interest in just about every sport who get a big kick out of making their particular athletic endeavor seem too difficult for ordinary mortals to comprehend, let alone master. I’ve been known to tell beginners how hard it is to shoot straight myself. Actually, making a boat or a horse go where you want it to, or making a gun go bang in the right direction isn’t all that tough once you’ve decided not to let the experts intimidate you.”
“The hardest thing to teach someone who has not grown up with guns is not how to shoot but when to shoot.”
“A man who aims a gun at you is a man who can kill you, and you don’t want to leave people like that standing around.”
“Getting money out of a bank is the hard part; any fool can put it in.”
“The Mexicans started it, I believe, and called it Siluetas Metalicas. They set up silhouette targets cut from heavy steel, gallinas, javelinas, guajalotes, and borregos, at distances ranging from 200 to 500 meters. The original idea was that, standing on your hind legs like a man-instead of lying on your belly like a worm-most serious target shooting is done from the prone position because it’s the steadiest-you try to knock over these heavy metal chickens, pigs, turkeys and sheep with one shot each, using your hunting rifle. It is a challenging sport.”
“The world is full of folks trying to impress other people with how brave they are; but the ones who survive are usually the ones who don’t mind looking cowardly when required.”
“The police gave me a hard time, of course. They don’t like finding a man with a gun, even an unfired gun, standing over a dead body. In fact, they don’t like to find a man with a gun, period. They want the firearms concession all to themselves.”
So this winter, because of a reprinting schedule I never expected, and the fact alibris covers a vast area, I’ll be reading the adventure novels I missed when I was stationed away from libraries and bookstores. -
Last Monday, I read that gold hit a new high at $2,135 per troy ounce. Back when Nixon was a president (his early years) it was $35. In 1792, the US government set the value at $19.75 per ounce. That changed to $20.67 in 1834, then a century later to $35 under Franklin Roosevelt. Nixon, though, saw the change through to $38 in 1972 and up to $42.22 in 1973.
I’m fairly certain that we could say that, based on the gold standard, the dollar just hit a new low. Carter’s first year shows $124.74 – Reagan came in at $460 . . . and in 1988 gold was down to $437. At the end of Bush the first, gold was down to $343.82.
The Clinton years – 1993 saw gold priced at $359.77 and 2000 saw the price drop to $279.11. In 2008, when Bush the second finished most of his term, gold was back up to $871.96. Under Obama, 2016 saw gold at $1,250.74.
This graph shows the price of silver from 1720: (as I write this, the spot price is $24.18)
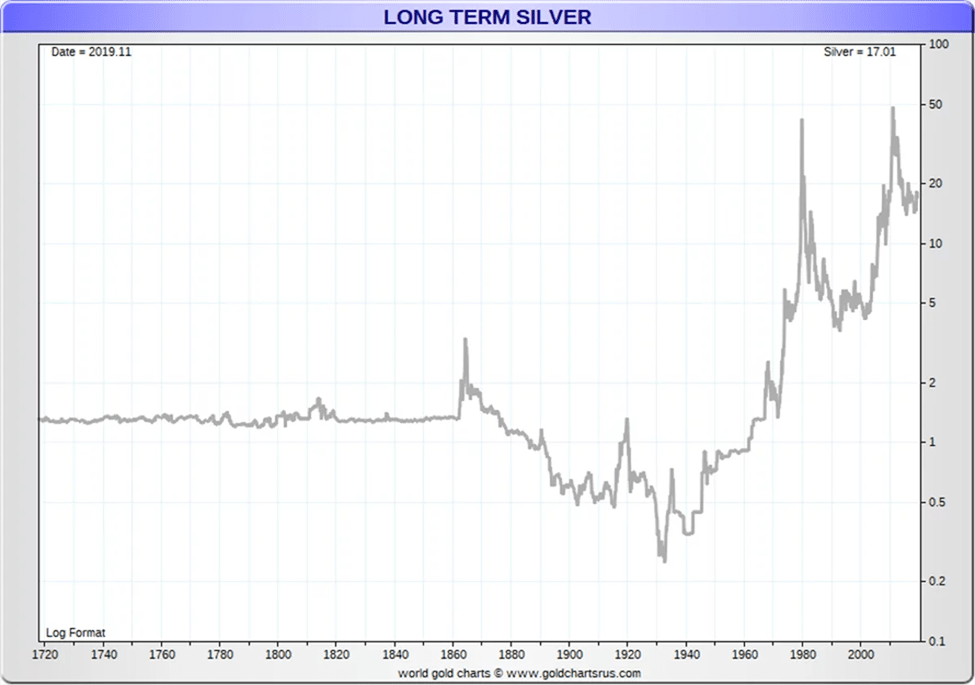
If I remember correctly, that spike in 1980 occurred when the Hunt brothers, a pair of Texas oilmen, tried to corner the silver market. The chart suggests they came closer than I realized.
Of course, we can also measure the dollar’s purchasing power in something we can eat – wheat for example:
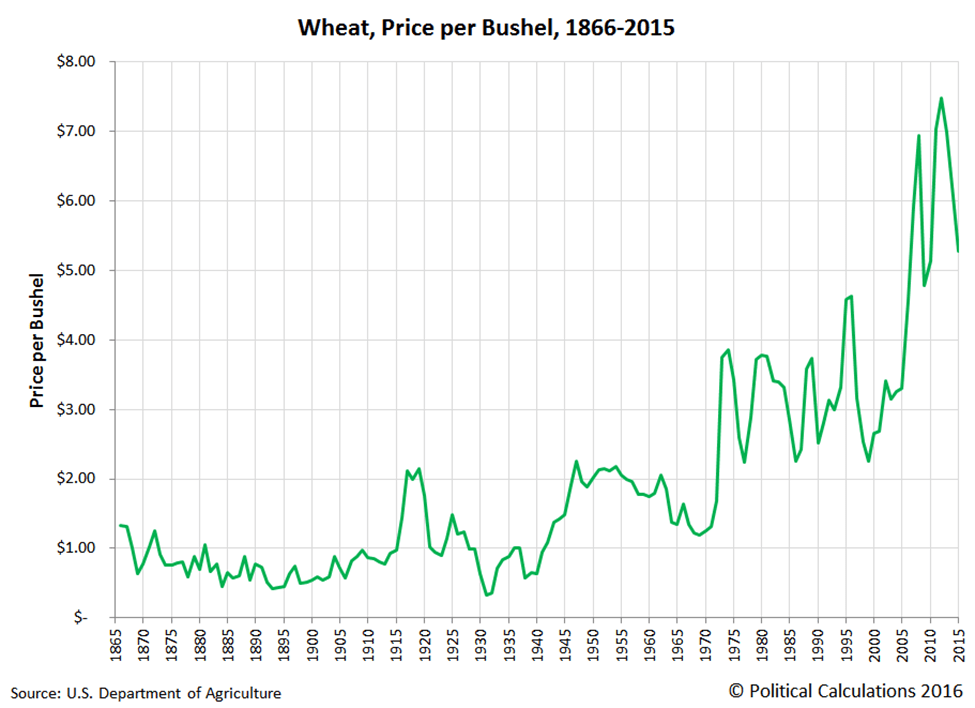
The high points of wheat during the first world war coincided with the time my grandfather had enough spare cash to buy the place in Trego. I don’t think he ever made out in the precious metals market.
-
I read that the nation is down to a single Arizona survivor – Lou Conter, age 102, retired Lieutenant Commander, but enlisted Quartermaster 3rd class on December 7, 1941. (A Navy Quartermaster should not be confused with the same title in the Army – in the Navy, the Quartermaster work the bridge, actually helmsman and navigation duties)
320 sailors and 15 marines on Arizona survived. 1,177 did not. No other action saw an entire ship’s band killed.
With Lt. Commander Conter at age 102, there is a research project ready to be written – statistically testing the power of identity as a survivor. The theories of Sheldon Stryker and Peter J. Burke suggest the importance of identity as a component of personality – and the lifetimes of those 335 men who survived the sinking of Arizona have moved into the statistical record.
I would probably start the project with a life-expectancy table for men born in 1920. Nobody does this as well as the Social Security Administration, and , while there 1920 table may not be available on line, I’m sure they have kept it. The 2020 table shows that of 100,000 boys born in 2020, only 200 can expect to make it to 102 years of age. That would translate to 0.67 of 335 . . . and Ken Potts, the second-to-last Arizona survivor died last April – at 102. It’s wrong to theorize with partial data – but partial data is the critical thing about developing a hypothesis. In this case, being classified as a survivor of the Arizona carried over into the remainder of the survivors lives, and can be demonstrated through lifespans and life expectancy tables.
If childhood memory serves – and I’m sure it does – funding the above Arizona memorial was started with a concert donated totally by Elvis Presley.
At any rate, most of the data is public – the 1920 life tables are available from the folks at social security. The dates of death of the Arizona survivors will be available at the USS Arizona Society web page – possibly not in a computer, but the folks at ussarizona.org have done a great job of keeping track of the Arizona survivors. Those sailors and marines have served – and the data they left as they went on with their lives can be used to test several theories of identity.
-
The Tax Foundation has an article at State and Local Tax Burdens, Calendar Year 2022 that shows Montana at 27th place on state and local taxes. I’m not certain that it’s a good thing to be above the mean when it comes to paying taxes – but they illustrate the article with this map:

An earlier article, at State and Local Individual Income Tax Collections Per Capita cuts it down to just income taxes, and shows a different legend to the map:

Essentially, 10.5% of Montana’s production goes to support the state and local government. Whether that is a good thing or a bad thing probably depends on whether you are employed by state or local government, or if you are a libertarian free-market capitalist. I’ve been both, so I can see both sides.
Data is available on the federal side of income taxes – How much money does the government collect per person? The article is worth reading – it tells that the average is $15,098 per person. It also includes this interesting graph:

-
As December begins, and thoughts turn to cat-proofing (if such a thing is possible) the Christmas decorations, I am reminded of a bit of Icelandic folklore. The Yule Cat, Jólakötturinn, is a giant cat very invested in whether or not folks are wearing new clothes for Christmas. While it’s not clear whether the individuals without new clothes get eaten, or just their food, it’s clear that the cat’s invested in the outcome.
There is, of course, music about it:
-
I’ve been looking at Trego School and how the school is funded. The state school levy is 95 mills. Then there’s a 6 mill levy for the university system. County-wide education gets another 23.7 mills. The high school gets 22.42 mills – and Trego school levies 40.87 mills.
The local board has input into 22 percent of the school taxes our residents pay. True, Trego has a single representative on the high school board (so does Fortine), but that board consists of the five member Eureka elementary board. Not complaining, mind you – just pointing out that most of our school taxes could be described as taxation without representation.
In 2014, Trego’s Real Property was assessed at 56 million dollars. The 2023 assessment is 140 million. The 2023 value is 2.5 times the 2014 value. I’ve seen a lot of comments about the rising cost of rent in Lincoln County – and most attribute it, without math, to the rising property values.
Incidentally, the Bureau of Labor Statistics calculator shows the change due to inflation (from October 2014 to October 2023) at 130 – just based on inflation, what cost one dollar back in 2014 costs $1.30 in 2023. It’s a good argument that low cost housing has disappeared from our area. If we take a hypothetical $500 rental from 2014 and adjust for inflation, we get $650. If we adjust for market value (multiply by 2.5), we get $1250.It’s been quite a while since a realtor gave me the quick way to value property: take the monthly rent, and multiply by 100. I suppose you could work it backwards – take the market value and divide by 100 to determine the rent. Regardless, rent should be 1% of the property value.
Using that one percent rule of thumb, that $500 rental had a market value of $50,000. Applying the same to 2023 and the $1250 rent, we see a home worth $125,000. The same general math works for funding the school – except in Trego, a large amount of the tax base is railroad . . . carried on the roll as “Centrally Assessed.” In 2014, that category was roughly 20 million. In 2023, it’s 28.6 million. While privately owned property went up 250%, the “Centrally Assessed” values went up 144% – a lot closer to the inflation numbers I get from the BLS.
Simply enough, as real property values have increased, the share of the tax burden that was once on Burlington Northern has shifted more to the small private landowner. As the tax bill on real property owners has gone up 250%, Trego School’s tax-based budget has increased by 156%. The school’s receipts aren’t keeping up with the tax increases.
Back in 1965 and 1966 Trego’s school board – Dad, Yolanda Nordahl, and Earl Meier – were happy with the results they had achieved. A new school building, and with the railroad relocation, a tax base that could support it in style for years. Trego was in its boomtown phase – the construction jobs brought new housing, and when the construction ended that led to artificially low rents for a generation. A new state constitution in 1972 resulted in a Supreme Court ruling that sends the lion’s share of the district’s school taxes to Helena for redistribution. The trendline is the same for LCHS, though the specific numbers are a bit different.
Trego continues to have the lowest tax rates – but the largest percentage of our taxes have been removed from local control.
My most recent tax bill was for 305 mills – and the equalization ruling will bring that past 320. When mills reach 1000, taxes become equal to taxable value. The charts show that taxable value has varied from 1.77% in 2014 to 1.22% in 2023 (of market value).
This only seems like a new situation for us – I recall an old guy in Libby who had built one of the first homes on Bighorn Terrace while he worked at the mill. Then, as a retiree and on a fixed income, he had to face an uncompromising equation – taxes and other fixed expenses were increasing far faster than his sawmill retirement and social security. He came by the Extension office asking me to check his math. I checked it. He was correct. He put the place up for sale and moved to Chester. Today, I typed in “Bighorn Terrace, Libby, MT” and saw two places advertised- one for $819,000 and one for $745,000. That 1% rule of thumb would put those houses renting for $7,500 to $8,000 a month. Bighorn Terrace and river frontage is still at a premium – and Chester remains more affordable. -
AI and machine learning are improving weather forecasts, but they won’t replace human experts

Meteorologist Todd Dankers monitors weather patterns in Boulder, Colorado, Oct. 24, 2018. Hyoung Chang/The Denver Post via Getty Images Russ Schumacher, Colorado State University and Aaron Hill, Colorado State University
A century ago, English mathematician Lewis Fry Richardson proposed a startling idea for that time: constructing a systematic process based on math for predicting the weather. In his 1922 book, “Weather Prediction By Numerical Process,” Richardson tried to write an equation that he could use to solve the dynamics of the atmosphere based on hand calculations.
It didn’t work because not enough was known about the science of the atmosphere at that time. “Perhaps some day in the dim future it will be possible to advance the computations faster than the weather advances and at a cost less than the saving to mankind due to the information gained. But that is a dream,” Richardson concluded.
A century later, modern weather forecasts are based on the kind of complex computations that Richardson imagined – and they’ve become more accurate than anything he envisioned. Especially in recent decades, steady progress in research, data and computing has enabled a “quiet revolution of numerical weather prediction.”
For example, a forecast of heavy rainfall two days in advance is now as good as a same-day forecast was in the mid-1990s. Errors in the predicted tracks of hurricanes have been cut in half in the last 30 years.
There still are major challenges. Thunderstorms that produce tornadoes, large hail or heavy rain remain difficult to predict. And then there’s chaos, often described as the “butterfly effect” – the fact that small changes in complex processes make weather less predictable. Chaos limits our ability to make precise forecasts beyond about 10 days.
As in many other scientific fields, the proliferation of tools like artificial intelligence and machine learning holds great promise for weather prediction. We have seen some of what’s possible in our research on applying machine learning to forecasts of high-impact weather. But we also believe that while these tools open up new possibilities for better forecasts, many parts of the job are handled more skillfully by experienced people.
Australian meteorologist Dean Narramore explains why it’s hard to forecast large thunderstorms. Predictions based on storm history
Today, weather forecasters’ primary tools are numerical weather prediction models. These models use observations of the current state of the atmosphere from sources such as weather stations, weather balloons and satellites, and solve equations that govern the motion of air.
These models are outstanding at predicting most weather systems, but the smaller a weather event is, the more difficult it is to predict. As an example, think of a thunderstorm that dumps heavy rain on one side of town and nothing on the other side. Furthermore, experienced forecasters are remarkably good at synthesizing the huge amounts of weather information they have to consider each day, but their memories and bandwidth are not infinite.
Artificial intelligence and machine learning can help with some of these challenges. Forecasters are using these tools in several ways now, including making predictions of high-impact weather that the models can’t provide.
In a project that started in 2017 and was reported in a 2021 paper, we focused on heavy rainfall. Of course, part of the problem is defining “heavy”: Two inches of rain in New Orleans may mean something very different than in Phoenix. We accounted for this by using observations of unusually large rain accumulations for each location across the country, along with a history of forecasts from a numerical weather prediction model.
We plugged that information into a machine learning method known as “random forests,” which uses many decision trees to split a mass of data and predict the likelihood of different outcomes. The result is a tool that forecasts the probability that rains heavy enough to generate flash flooding will occur.
We have since applied similar methods to forecasting of tornadoes, large hail and severe thunderstorm winds. Other research groups are developing similar tools. National Weather Service forecasters are using some of these tools to better assess the likelihood of hazardous weather on a given day.
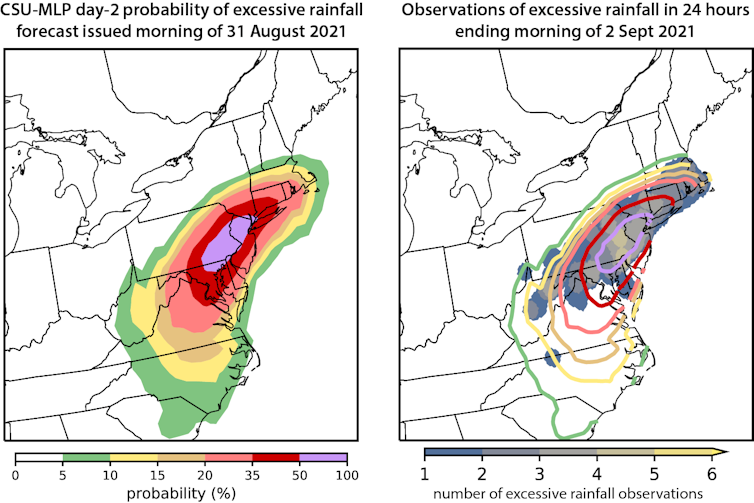
An excessive rainfall forecast from the Colorado State University-Machine Learning Probabilities system for the extreme rainfall associated with the remnants of Hurricane Ida in the mid-Atlantic states in September 2021. The left panel shows the forecast probability of excessive rainfall, available on the morning of Aug. 31, more than 24 hours ahead of the event. The right panel shows the resulting observations of excessive rainfall. The machine learning program correctly highlighted the corridor where widespread heavy rain and flooding would occur. Russ Schumacher and Aaron Hill, CC BY-ND Researchers also are embedding machine learning within numerical weather prediction models to speed up tasks that can be intensive to compute, such as predicting how water vapor gets converted to rain, snow or hail.
It’s possible that machine learning models could eventually replace traditional numerical weather prediction models altogether. Instead of solving a set of complex physical equations as the models do, these systems instead would process thousands of past weather maps to learn how weather systems tend to behave. Then, using current weather data, they would make weather predictions based on what they’ve learned from the past.
Some studies have shown that machine learning-based forecast systems can predict general weather patterns as well as numerical weather prediction models while using only a fraction of the computing power the models require. These new tools don’t yet forecast the details of local weather that people care about, but with many researchers carefully testing them and inventing new methods, there is promise for the future.
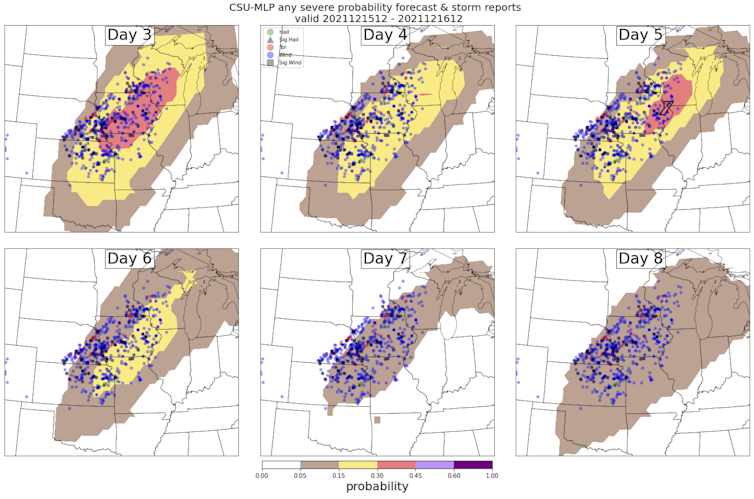
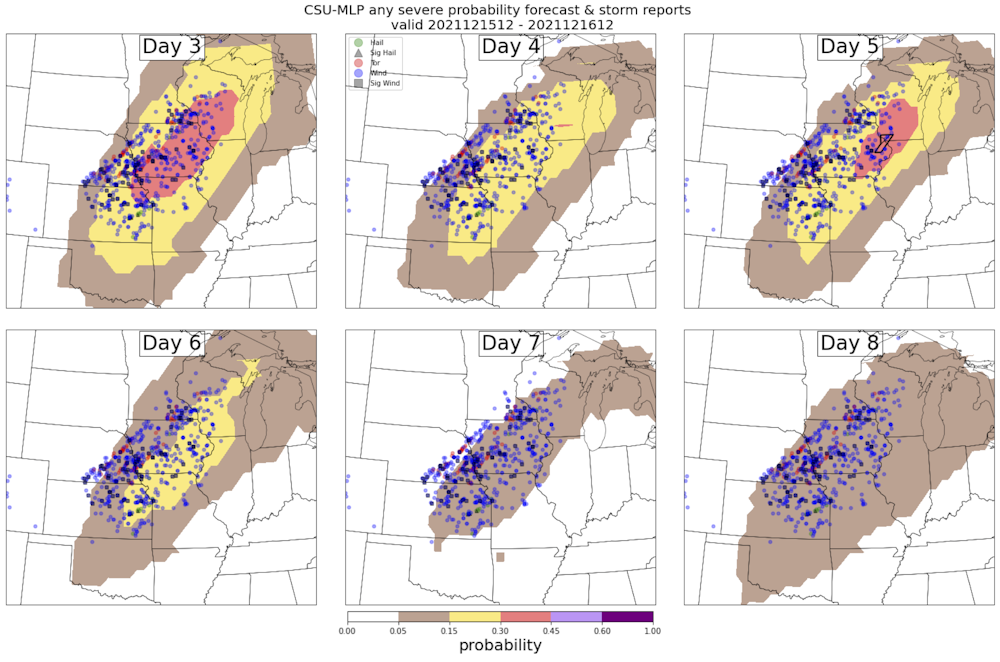
A forecast from the Colorado State University-Machine Learning Probabilities system for the severe weather outbreak on Dec. 15, 2021, in the U.S. Midwest. The panels illustrate the progression of the forecast from eight days in advance (lower right) to three days in advance (upper left), along with reports of severe weather (tornadoes in red, hail in green, damaging wind in blue). Russ Schumacher and Aaron Hill, CC BY-ND The role of human expertise
There are also reasons for caution. Unlike numerical weather prediction models, forecast systems that use machine learning are not constrained by the physical laws that govern the atmosphere. So it’s possible that they could produce unrealistic results – for example, forecasting temperature extremes beyond the bounds of nature. And it is unclear how they will perform during highly unusual or unprecedented weather phenomena.
And relying on AI tools can raise ethical concerns. For instance, locations with relatively few weather observations with which to train a machine learning system may not benefit from forecast improvements that are seen in other areas.
Another central question is how best to incorporate these new advances into forecasting. Finding the right balance between automated tools and the knowledge of expert human forecasters has long been a challenge in meteorology. Rapid technological advances will only make it more complicated.
Ideally, AI and machine learning will allow human forecasters to do their jobs more efficiently, spending less time on generating routine forecasts and more on communicating forecasts’ implications and impacts to the public – or, for private forecasters, to their clients. We believe that careful collaboration between scientists, forecasters and forecast users is the best way to achieve these goals and build trust in machine-generated weather forecasts.
Russ Schumacher, Associate Professor of Atmospheric Science and Colorado State Climatologist, Colorado State University and Aaron Hill, Research Scientist, Colorado State University
This article is republished from The Conversation under a Creative Commons license. Read the original article.
-
Argentina is considering abandoning their own inflated currency and moving to the Yankee Dollar. Countries Using the US Dollar provides this list of countries where the US dollar is the currency:
Countries Where the US Dollar is the Official Currency US Territory or Foreign Country Relationship with United States Geographic Location Population (2020) Gross Domestic Product (2020) United States of America Federal Republic North America 331,501.08 Thousand $20.95 Trillion Commonwealth of Puerto Rico Unincorporated territory of the U.S. Northeastern Caribbean 3,281.54 Thousand $103.14 Billion Ecuador Independent country Northwestern South America 17,643.06 Thousand $98.81 Billion Republic of El Salvador Independent country Central America 6,486.20 Thousand $24.63 Billion Republic of Zimbabwe Independent country Southeast Africa 14,862.93 Thousand $18.05 Billion Guam Unincorporated territory of the U.S. Western Pacific Ocean 168.78 Thousand $5.84 Billion The Virgin Islands of the United States Insular area territory of the U.S. Caribbean 106.29 Thousand $4.07 Billion (2019) The British Virgin Islands British Overseas Territory Caribbean 30.24 Thousand Not Available Democratic Republic of Timor-Leste Independent country Maritime Southeast Asia 1,318.44 Thousand $1.90 Billion Bonaire Kingdom of Netherlands Municipality Caribbean 20.10 Thousand (2019) $553 Million (2020) American Samoa Unincorporated territory of the U.S. South Pacific Ocean 55.20 Thousand $709 Million Commonwealth of the Northern Mariana Islands Unincorporated territory of the U.S. Western Pacific Ocean 57.56 Thousand $1.18 Billion (2019) Federated States of Micronesia Six Sovereign Countries Subregion of Oceania 115.02 Thousand $410.08 Million Republic of Palau Island Country Western Pacific Ocean 18.09 Thousand $257.70 Million Marshall Islands Island Country Near Equator in the Pacific Ocean 59.19 Thousand $244.46 Million Panama Independent Country Central America 4,314.77 Thousand $53.98 Billion Turks and Caicos British Overseas Territory Caribbean 38.72 Thousand $924.58 Million Source: The World Bank, Long Reads CBS, World Population Review It’s an interesting solution for a nation that hasn’t had the discipline not to keep printing money and spend beyond its means. Essentially, the countries that have adopted the US dollar as their currency have outsourced their financial policy to Washington DC – which is a definite statement about how bad their politicians must be.
The Grumpy Economist: Pro Dollarization covers the topic in better detail than I – click the link now, or read a couple of teasers before you go to it.
“Precommitment is, I think, the most powerful argument for dollarization (as for euorization of, say, Greece): A country that dollarizes cannot print money to spend more than it receives in taxes. A country that dollarizes must also borrow entirely in dollars, and must endure costly default rather than relatively less costly inflation if it doesn’t want to repay debts.”
“Dollarization is no panacea. It will work if it is accompanied by fiscal and microeconomic reform. It will be of limited value otherwise. I’ll declare a motto: All successful inflation stabilizations have come from a combination of fiscal, monetary and microeconomic reform.
Dollarization does not magically solve intractable budget deficits. Under dollarization, if the government cannot repay debt or borrow, it must default. And Argentina has plenty of experience with sovereign default. Argentina already borrows abroad in dollars, because nobody abroad wants peso debt, and has repeatedly defaulted on dollar debt.”
Hopefully these teasing paragraphs have you ready to click the link. I follow Professor Cochrane’s blog every week or so, and his articles are worth your time.
Years ago, in South America, I learned that tipping with crisp George Washington greenbacks early in my stay bought better service for the duration. It looks like the Argentine politicians may be becoming as smart as the waiters and waitresses were then.

Want to tell us something or ask a question? Get in touch.

Recent Posts
- Recovery Time for a Retiree
- Venn Diagram and DSM
- When Castro Was Cool
- You Have To Beat Darwin Every Day
- Computer Repair by Mussolini
- Getting Alberta Oil to Market
- Parties On Economics
- Thus Spake Zarathustra – One More Time
- Suspenders
- You Haven’t Met All The People . . .
- Play Stupid Games, Win Stupid Prizes
- The Ballad of Lenin’s Tomb

Rough Cut Lumber
Harvested as part of thinning to reduce fire danger.
$0.75 per board foot.
Call Mike (406-882-4835) or Sam (406-882-4597)
Popular Posts
Ask The Entomologist Bears Books Canada Census Community Decay Covid Covid-19 Data Deer Demography Education Elections Eureka Montana family Firearms Game Cameras Geese Government Guns History Inflation life Lincoln County Board of Health Lincoln County MT Lincoln Electric Cooperative Montana nature News Patches' Pieces Pest Control Politics Pond Recipe School School Board Snow Taxes travel Trego Trego Montana Trego School Weather Wildlife writing
