-
As near as I can tell, I spent 27 years in the Militia – without drills, training, promotion or action.
Here’s the beginning of the Militia Act of 1792, with the pertinent section highlighted in yellow:
“The Militia Act of 1792, Passed May 8, 1792, providing federal standards for the organization of the Militia.
An ACT more effectually to provide for the National Defence, by establishing an Uniform Militia throughout the United States.
I. Be it enacted by the Senate and House of Representatives of the United States of America, in Congress assembled, That each and every free able-bodied white male citizen of the respective States, resident therein, who is or shall be of age of eighteen years, and under the age of forty-five years (except as is herein after excepted) shall severally and respectively be enrolled in the militia, by the Captain or Commanding Officer of the company, within whose bounds such citizen shall reside, and that within twelve months after the passing of this Act. And it shall at all time hereafter be the duty of every such Captain or Commanding Officer of a company, to enroll every such citizen as aforesaid, and also those who shall, from time to time, arrive at the age of 18 years, or being at the age of 18 years, and under the age of 45 years (except as before excepted) shall come to reside within his bounds; and shall without delay notify such citizen of the said enrollment, by the proper non-commissioned Officer of the company, by whom such notice may be proved. That every citizen, so enrolled and notified, shall, within six months thereafter, provide himself with a good musket or firelock, a sufficient bayonet and belt, two spare flints, and a knapsack, a pouch, with a box therein, to contain not less than twenty four cartridges, suited to the bore of his musket or firelock, each cartridge to contain a proper quantity of powder and ball; or with a good rifle, knapsack, shot-pouch, and powder-horn, twenty balls suited to the bore of his rifle, and a quarter of a pound of powder; and shall appear so armed, accoutred and provided, when called out to exercise or into service, except, that when called out on company days to exercise only, he may appear without a knapsack. That the commissioned Officers shall severally be armed with a sword or hanger, and espontoon; and that from and after five years from the passing of this Act, all muskets from arming the militia as is herein required, shall be of bores sufficient for balls of the eighteenth part of a pound; and every citizen so enrolled, and providing himself with the arms, ammunition and accoutrements, required as aforesaid, shall hold the same exempted from all suits, distresses, executions or sales, for debt or for the payment of taxes.”
Obviously, my captain or commanding officer was derelict in his duty to notify me without delay. In general, I accidentally complied – except for the bayonet. While I’ve never been into flintlocks, I have had a couple of flints around. Still, I went through my 28 years of militia duty without effort or realization. I didn’t even get the T-shirt. I remember a guy down in Trout Creek or Noxon who promoted himself to general in the militia of Montana – but I went in without rank or realization and left the same way. At least nobody pressed AWOL charges against me when I was out of state.
US Code 246 pretty well defines my role – I was in the unorganized Militia:
(a)The militia of the United States consists of all able-bodied males at least 17 years of age and, except as provided in section 313 of title 32, under 45 years of age who are, or who have made a declaration of intention to become, citizens of the United States and of female citizens of the United States who are members of the National Guard.
(b)The classes of the militia are—
(1)the organized militia, which consists of the National Guard and the Naval Militia; and
(2)the unorganized militia, which consists of the members of the militia who are not members of the National Guard or the Naval Militia.Another Act – one that describes how I can get myself a cold war recognition certificate:
“Under the 1998 National Defense Authorization Act, the Secretary of Defense approved awarding Cold War Recognition Certificates to all members of the armed forces and qualified federal government civilian personnel who faithfully and honorably served the United States anytime during the Cold War era, which is defined as Sept. 2, 1945 to Dec. 26, 1991.
The program to issue the Cold War Recognition Certificate is run by the United States Army. There is an official Army web site where you can request Cold War Recognition Certificates. This site should be used by everyone who qualifies for the certificate, no matter which branch of the armed forces or agency of the federal government you served. Please click on the link: http://www.koreanveterans.org/forms/Application_for_Cold_War_Recognition_Certificate_US.pdf “
Not just any unorganized militia member can get this certificate – my eligibility comes from time working for the Department of Agriculture. Another website describes the Cold War victory medal:
Cold War Victory Medal Ribbon
The Cold War Victory Medal Ribbon is an unofficial award for personnel who served honorably during the Cold War. Due to its unofficial capacity, it cannot be worn in uniform.

Somehow, I don’t think that wearing the ribbon into the VFW would get me any respect. I haven’t put in for the certificate, and I don’t need the ribbon to go with my unorganized, effortless 27 years in the militia.
-
I had a role in some bad research. It was back in 2007, published in 2008, and a project my head of department authorized. Donna’s listed as co-author, as I am – but the lead authors were grad students at the time – Trevor and Staci. Rural Life Census Data Center Newsletter: South Dakota’s Food Deserts is the address of our blunder. It’s still getting downloads.
I’m thinking of this because I read of Stanford’s president’s resignation this morning – over faulty research showing up in a 2009 article. There are some differences – but it’s worth talking about the opportunities that exist to do flawed research.
The nice thing for me was that my department head, Donna Hess, started the project, and Trevor was the lead author – so I wasn’t the man who got the phone call from a grocer in Small Town South Dakota who was angry about his town, his county, being classified as a food desert. Trevor spent over an hour learning just how screwed up his research and findings were – and, at the end, we still had to figure out what had happened and how we went wrong.
Food deserts had become a catchphrase. The definition was “Food deserts are areas in which all residents “have low access to large food retailers” (p. 1); specifically, each person in a food desert lives more than 10 miles away from a supermarket (Morton and Blanchard 2007).” Our article started with that phrase – but none of us had checked which piece of data Morton and Blanchard had used to indicate a food store that qualified the county as a food desert. It was the number of employees in the retail food store – readily available from the Bureau of Labor and Statistics. Shannon County (Pine Ridge) had a large turnover of part-time employees in their grocery store, so the Pine Ridge didn’t qualify as a food desert.
I made a point of visiting the Small Town grocer who had been so angry about his town’s classification as a food desert. The plus was that I had been included as co author because of a separate research project that was yet unpublished, and the article that he found so offensive documented that. His grocery operation was ran by a large family who worked long hours and did not meet Morton and Blanchard’s criteria – but was definitely not a food desert. It’s easier to make apologies when the guy you’re apologizing to knows it really wasn’t your blunder (being 6’3” tall may also help get your apologies accepted.)
Obviously, in rural America, the number of store employees didn’t correlate well with the diversity and quality of food in the store. Just as obviously, the correlation was pretty good in urban America. The thing was, our department was rural sociology – and the research techniques that worked well in cities with populations larger – much larger – than our state fell apart in counties with populations of three or four thousand people.
All of the authors are gone – but the article continues to be available, and downloaded.
-
Note: Our question- is this Australian study still using the same definition that so annoyed that South Dakota grocer back in ’09? This was published this year. The USDA does have a map– they’ve replaced the phrase “food desert” with “low income, low access”, but regardless, that’s how Linconln County is currently classified.
Are you living in a food desert? These maps suggest it can make a big difference to your health

Shutterstock Nicky Morrison, Western Sydney University and Gregory Paine, UNSW Sydney
Public concerns about high food prices highlight how meeting basic human needs can’t be taken for granted, even in a country like Australia.
Food prices are but one part of the equation that determines access to food – and healthy eating more generally. Just as poverty for some can be hidden within a relatively wealthy community, lack of access to fresh affordable foods can be a problem even in our largest cities.
The term “food desert” describes this concern. It is believed to have been first coined in the United Kingdom. It’s now widely used in the United States and also in Australia.
People living in food deserts lack easy access to food shops. This is usually due to combinations of:
- travel distances as a result of low-density suburban sprawl
- limited transport options
- zoning policies that prohibit the scattering of shops throughout residential areas
- retailers’ commercial decisions that the household finances of an area won’t support a viable food outlet.
The term “healthy food desert” describes an area where food shops are available, but only a limited number – or none at all – sell fresh and nutritious food.
Our recent research looks at whether food deserts might exist in a major local government area in Western Sydney. We mapped locations of outlets providing food – both healthy and unhealthy food – and of local levels of disadvantage and health problems.
Our initial results are disturbing. We found nearly two-thirds of suburbs have no food stores at all. In those that have them, only 16% of the stores are healthy food outlets.
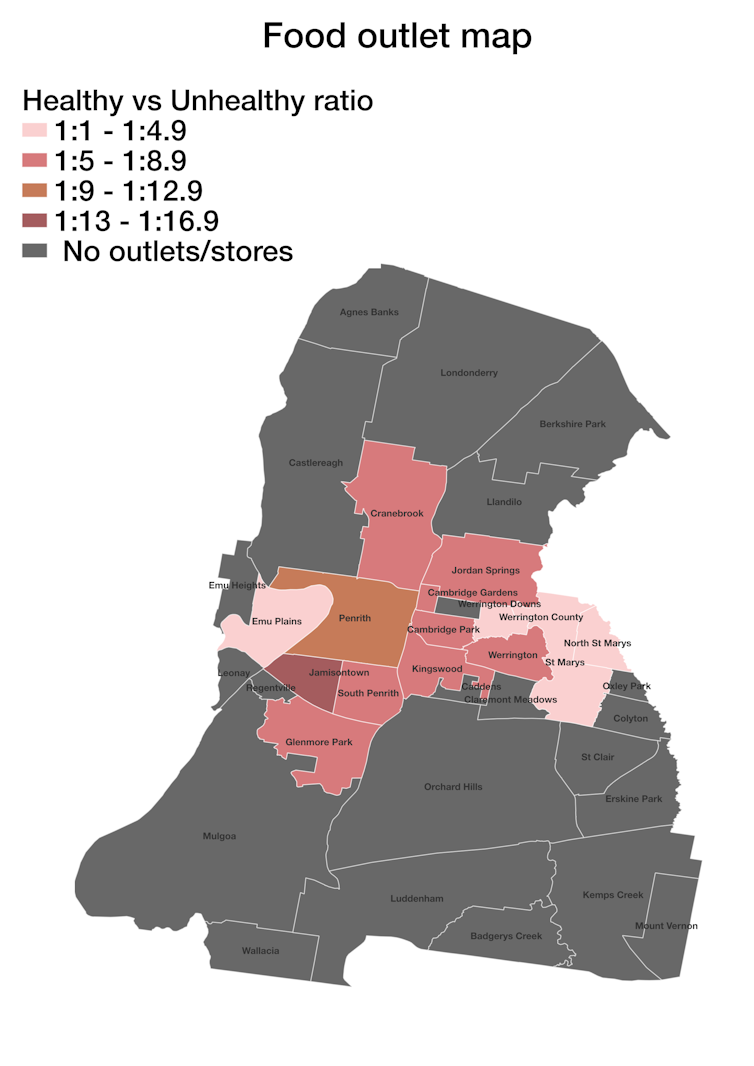
This map shows the ratio of healthy food outlets to non-healthy outlets for each suburb. Source: A rapid-mapping methodology for local food environments, and associated health actions: the case of Penrith, Australia, Author provided The maps also show strong correlations between these food deserts and areas of poor public health and socioeconomic disadvantage.
How did the study assess the area?
Our research took a rapid appraisal approach to assess whether food deserts might be present in the study area.
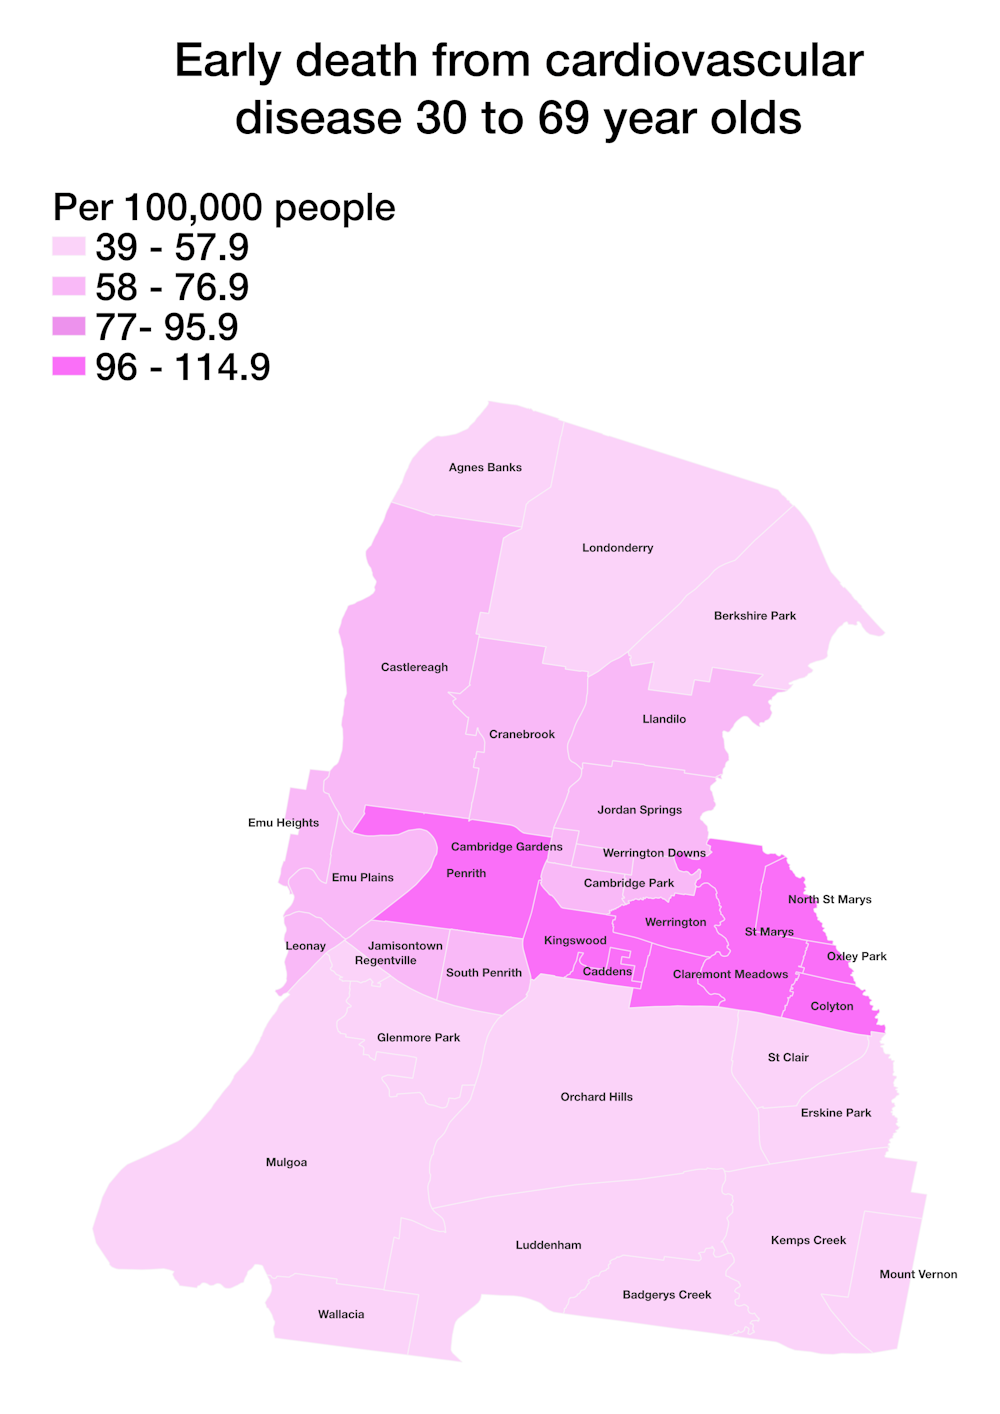
Health data from the Australian Health Policy Collaboration indicate concerning rates of overweight and obesity, diabetes and early deaths from cardiovascular disease in these areas.

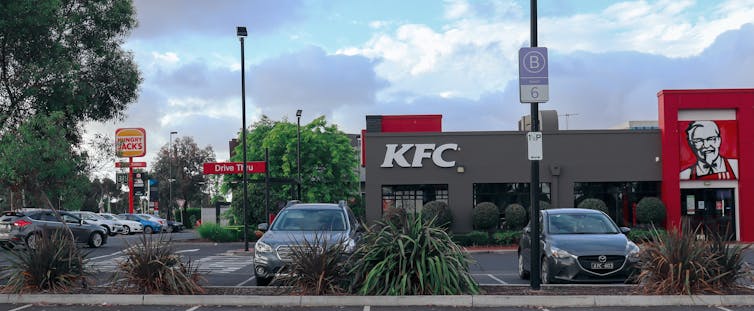
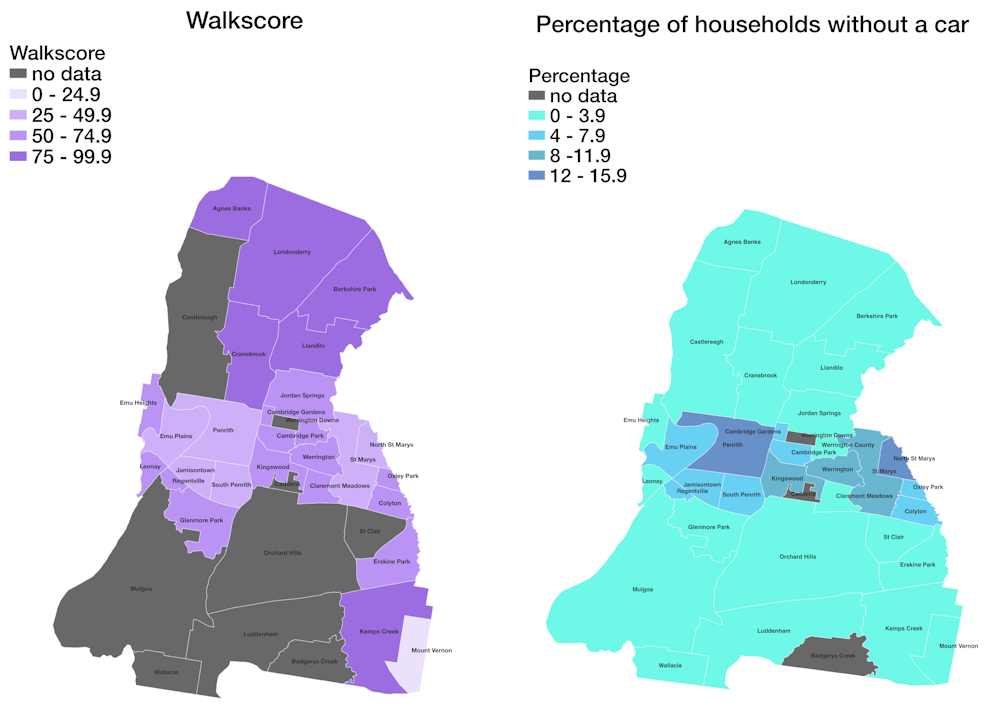
This map shows rates of early death from cardiovascular disease for each suburb. Source: A rapid-mapping methodology for local food environments, and associated health actions: the case of Penrith, Australia, Author provided As for the physical environment, the local government area is made up of large single-use residential zones, inconvenient distances to shops, and many fast-food outlets. Walk Score ratings of the suburbs indicate how much a car is needed for almost all errands. People who don’t have a car face real hurdles to accessing affordable, healthier food options.

These maps show the Walk Score and car ownership rates for each suburb (more walkable neighbourhoods have a higher Walk Score). Source: A rapid-mapping methodology for local food environments, and associated health actions: the case of Penrith, Australia, Author provided We used other data sets (online business directories, store locators and Google maps) to plot the locations of food outlets and make an initial assessment of the types of food they offer. We broadly classified these as “healthy” (chain-operated and independent supermarkets, multicultural grocery stores – mostly Asian and African in this area – and fruit and vegetable shops) and “unhealthy” (independent and franchise takeaway stores and certain restaurants and cafés).
We mapped the health and livability indicators and food outlets in different colours.
The coloured maps offer quick, informative and approachable appraisals of the situation. Because community members can easily interpret them, the maps may help to prompt community action to improve the situation.
What did the study find?
Overall, “non-healthy” food outlets account for 84% of all food outlets in the local government area.
Further, all food outlets (healthy and non-healthy) are located in 14 suburbs. This means 22 suburbs have no food stores at all. The 14 suburbs with food outlets also commonly have more – at times substantially more – unhealthy than healthy stores.
In the areas with food outlets, less healthy options typically outnumbered the ones offering healthy fresh food. Shutterstock The mapping also shows a strong correlation between suburbs with large proportions of unhealthy stores and those with greater levels of disadvantage (using the Australian Bureau of Statistics index of relative socioeconomic disadvantage). The suburb ranked as the most disadvantaged, for instance, has six unhealthy food stores but no healthy food stores. Its Walk Score indicates residents depend on the car and could manage few errands by foot.
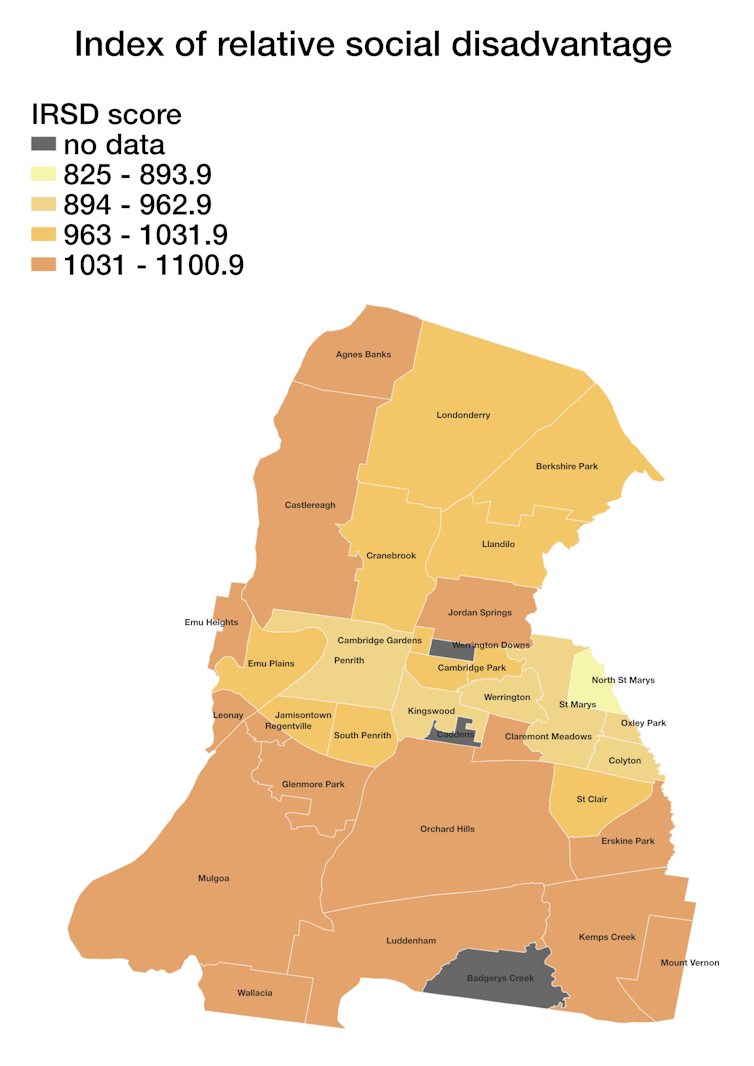
In this map of relative social disadvantage by suburb, lower scores indicate greater disadvantage. Source: A rapid-mapping methodology for local food environments, and associated health actions: the case of Penrith, Australia, Author provided Our rapid appraisal method does not provide all the answers. Care needs to be taken to not fall into the trap of over-interpretation.
Nor should food outlets themselves be seen as a proxy for healthy or unhealthy eating. They are but one of several factors to be considered in assessing whether people are eating healthily.
What can be done about these issues?
It’s clear large parts of this urban area do not support residents’ health and wellbeing by providing good access to healthy food choices.
Urban policy can be effective in eliminating food deserts. Social, land use and community health actions always need to be on the ball and targeted to need.
After all, diet-related choices are not just an outcome of personal preferences. The availability of food outlets, and the range of foods they sell, can influence those choices – and, in turn, nutrition and health.
Our findings pinpoint where targeted investigations should be directed. Determining the exact nature of this lack of choice will help policymakers work out what can be done about it.
It’s an approach well worth taking throughout Australia to check where there might be similar hidden concerns.
Our study lists other proven tools to assist follow-up research that our work has shown is needed. These include:
- onsite appraisals of individual food outlets
- assessments of the freshness and affordability of items on offer
- more detailed local accessibility data
- direct surveys of residents’ experiences of their local food environments.
We all deserve to live and work in places that intrinsically support, rather than detract from, healthy choices and behaviours, and therefore our health itself.
Ruvimbo Timba, a planning officer at the NSW Department of Planning and Environment and formerly of Western Sydney University, is a co-author of this article.
Nicky Morrison, Professor of Planning and Director of Urban Transformations Research Centre, Western Sydney University and Gregory Paine, Research assistant, Western Sydney University, UNSW Sydney
This article is republished from The Conversation under a Creative Commons license. Read the original article.
-
Chemically, if we were playing “which one is not like the others” with artificial sweeteners, we’d choose Aspartame. Unlike most of the artificial sweeteners, it’s not a carbohydrate.

It’s not “zero calorie” in the way that many artificial sweeteners are, but is still used because it’s considerably sweeter than glucose, and can be used to greatly reduce the calorie content of a food. It’s quite common in diet sodas, but not typically found in anything that is heated as part of the food preparation process, as the molecule does not survive intact.
Aspartame was discovered in 1965 because James Schlatter licked it off of his finger. It does not taste precisely the same as sugar. Although it is sweet, it takes somewhat longer for taste buds to register it as sweet and it has an aftertaste. It’s frequently mixed with other artificial sweeteners.
It’s been approved and disapproved for human consumption on several occasions- it’s currently approved by the FDA and considered well studied. The general idea seems to have been that aspartame is relatively safe, unless you have a reason to be avoiding phenylalanine.
The current (not quite two weeks ago!), relevant question on Aspartame is: Does it cause cancer? There’s some new research out, suggesting that it does, though the FDA disagrees. The implication is that there may be a link between aspartame consumption and liver cancer, though the conclusion seems to be “further study needed”.
-
WHO expert cancer group states that the sweetener aspartame is a possible carcinogen, but evidence is limited – 6 questions answered

Research on possible links between aspartame consumption and cancer is ongoing and far from conclusive. celsopupo/iStock via Getty Images Plus Paul D. Terry, University of Tennessee; Jiangang Chen, University of Tennessee, and Ling Zhao, University of Tennessee
The World Health Organization declared on July 14, 2023, that the widely used synthetic sweetener aspartame could be a “possible” carcinogen, or cancer-causing agent, on the basis of “limited evidence for cancer in humans.”
But the agency also concluded that the currently available data does not warrant a change of the acceptable daily intake of aspartame at this time.
The Conversation asked chronic disease epidemiologist Paul D. Terry, public health scholar Jiangang Chen and nutrition expert Ling Zhao, all from the University of Tennessee, to put these seemingly contradictory findings into perspective based on the available scientific evidence.
1. Why is aspartame being classified as ‘possibly’ cancer-causing?
Aspartame is an artificial sweetener that is added to many foods, candies, gums and beverages, such as diet soda. Because it is approximately 200 times sweeter than table sugar, smaller amounts of aspartame are added to foods, and they contribute considerably fewer calories. NutraSweet and Equal are well-known brand names for aspartame sold in packages for individual use.
The International Agency for Research on Cancer, an entity within the WHO, evaluated findings from both human and animal studies of aspartame and cancer. The group noted some positive associations between aspartame consumption and hepatocellular carcinoma, a form of liver cancer.
This WHO group classifies degrees of evidence that an agent has cancer-causing potential as being “sufficient,” “limited,” “inadequate” or “suggesting lack of carcinogenicity.” “Limited” evidence, as it pertains to the WHO’s new announcement on aspartame, means that although there is some evidence for an association, that evidence cannot be considered “sufficient” to infer a causal relationship.
Ultimately, the group concluded that several limiting factors could possibly explain the positive associations in those studies. These include the small number of human studies available, the complexity of studying people’s dietary behaviors and possible bias from factors such as higher-risk people – for example, those with diabetes – selecting diet products more often and ingesting higher quantities of aspartame than the average consumer. Therefore, the classification of “limited evidence” implies the need for additional studies. https://www.youtube.com/embed/fFvzK-x02Mw?wmode=transparent&start=0 Aspartame is found in many products: diet soda, ice cream, cereals, toothpaste and even some medications.
2. What are the current guidelines for aspartame consumption?
The Food and Agriculture Organization’s Joint Expert Committee on Food Additives, an international committee of science experts that is operated by both the WHO and the United Nations, currently recommends a daily maximum of 40 milligrams per kilogram of body weight for aspartame.
This amount of aspartame per day translates to approximately eight to 12 cans of soda, or approximately 60 packets of aspartame, for a person weighing 132 pounds (60 kilograms). For a child weighing 33 pounds (15 kg), it translates to between two to three cans of aspartame-sweetened soda per day, or approximately 15 packets of aspartame. Some individuals may consume more aspartame than this, but such high intake is not typical.
3. Does the WHO’s new stance change that recommendation?
Independently of the expert panel on cancer, the food safety group also evaluated the available evidence and concluded that there was no “convincing evidence” from either animal or human studies that aspartame consumption causes adverse effects within the currently established daily limits.
Based on assessments of the findings of both groups, the director of the Department of Nutrition and Food Safety of the WHO stated that, “while safety is not a major concern” at the doses in which aspartame are commonly used, “potential effects have been described that need to be investigated by more and better studies.” The American Cancer Society has also stated that it supports further research into possible health concerns related to aspartame.
It is important to note that people with the rare inherited disorder called phenylketonuria, or PKU, should avoid or restrict aspartame intake.
4. How can two consensus groups reach different conclusions?
It is not uncommon for scientific consensus groups to differ in how they classify risk based on the results of published studies, even if more than one of those consensus groups is affiliated with the same agency or parent organization.
Whereas the WHO’s expert cancer group’s stance may appear to be more worrisome than that of the committee on food safety, in fact, the latter’s “no convincing evidence” is consistent with the cancer group’s “limited evidence” classification. Because, unlike the cancer group, the food safety committee considers risk of aspartame at specific consumption levels, the WHO as a whole continues to support the food safety committee’s existing recommendations for allowable daily aspartame intake of up to 40 milligrams per kilogram of body weight.
Of note, the committee’s recommended maximum daily intake is still more conservative than the current U.S. Food and Drug Administration’s recommended maximum daily allowance of 50 milligrams of aspartame per kilogram of body weight.
5. How does aspartame compare to other sweeteners?
Alternatives to aspartame include other artificial sweeteners such as saccharin and sucralose, sugar alcohols like sorbitol and xylitol, naturally derived sugar-free sweeteners like Stevia and simple sugars, such as those in sugar cane, sugar beets and honey.
But, like aspartame, many of these sweeteners have been implicated in developing cancer. This list includes acesulfame potassium, or Ace-K – a synthetic calorie-free sugar substitute – as well as sugar alcohols and even simple sugar.
The availability of a wide variety of approved sweeteners seems like a good thing, but studying the many possible risks associated with sweeteners is challenging, since people have complex diets and lifestyles.
6. So what should consumers do?
For now, as is the case with aspartame, these sweeteners remain approved for human use because there isn’t sufficient evidence to support an association with cancer. And, as noted by the Mayo Clinic, artificial sweeteners may play a beneficial role for some people who are seeking to manage their weight or control their sugar intake. Studies show that sugar may be addictive for some individuals.
When making a decision about consumption of sweeteners, consumers should consider factors like taste preference, body weight and composition, diabetes status and risk, possible allergic responses and the evidence that may result from ongoing and future studies. In certain cases, such as with individuals who have or are at future risk of diabetes, people should talk with their physician or other health care provider to determine the best choice.
One thing is clear: Scientific studies on aspartame consumption will continue, and it will be important for both consumers and the research community to continue weighing potential risks.
Paul D. Terry, Professor of Epidemiology, University of Tennessee; Jiangang Chen, Associate Professor of Public Health, University of Tennessee, and Ling Zhao, Professor of Nutrition, University of Tennessee
This article is republished from The Conversation under a Creative Commons license. Read the original article.
-
It’s 6:39 am on June 29, and the sun is bright as it climbs above Stryker Peak. It’s a small solar observation for me that occurs twice each summer, controlled by the location where I built, and observed because the living room window, ideally placed to observe wildlife in the hayfield, also includes Stryker Peak. It will happen again next June 13.
In Alaska, they have the Midnight Sun. Here, I have the smaller, unique sunrise over Stryker. It is enough – the Finns and Alaskans have a month or two of the Midnight Sun – I have four or five minutes, twice each June, of sunrise over Stryker Peak. I guess that part of Summer is physics and astronomy.
Biology – specifically predation – is showing up this year among the birds. Last year, 3 turkey hens gathered together to protect their remaining 4 chicks from the ravens. This year, the 3 more experienced hens are still together with a flock of 15 hatchlings. A fourth hen has entered the group bringing in two more hatchlings. The ravens nest in the same area, and protecting the little turkeys from them is a contest we watch from across the field. It’s hard for a single turkey hen to protect her little ones from 3 or 4 ravens – but the group approach seems to offer more success.
This is the first year that predators have taken out adult geese – the grass is tall, and while I am guessing the predator is a bald eagle, first the gander disappeared, and mother goose tried to move her flock in with her father’s. Then she disappeared, and Old Gander’s flock shows one more hatchling moved in between the parents, while the rest of the orphans try to stay close but don’t move in . . . and we’ve seen one dead gosling, and several have gone missing.
The swallows arrived late, and are now working to reduce the mosquito population.
A week and a half after I started writing this, I watched the bald eagle prey on an orphan gosling. It is not a pretty sight. The world has no shortage of Canada geese – but these have became friends and neighbors over the years. Gander maintains his now expanded flock in the larger pond, and they graze along the steep south bank, where an aerial attack is more risky to the attacker. Still, it is the season for molting – and then comes flight training for the goslings. There’s another month of risk before the geese will be taking to the air – and a grounded grazing goose has lost a lot of defensive abilities.
The turkey flock is up to five hens, and nearly two dozen small turkeys. They have coped with raven predation, and the bald eagle doesn’t seem to be bothering them. The mallards first lost the hen, and now most of those little ducks have been picked off. The summer has had more predation than before.
Next Spring, with the eagle preying on geese, the island may not be the safe place for hatching eggs it has been. Survival strategies have to change with the predators.
-
The Supreme Court has ruled against – well, call it race-based admissions discriminating against students of Asian origin at Harvard and UNC. It gets me thinking back to college admissions back when I was 17 – maybe 16. I had all but completed my first term in college when I turned 18 and registered for the draft.
On one hand, I had the test scores -SAT and ACT – for admission to any university in the country. On the other hand, my scores didn’t get scholarship offers from the Ivies. On the third hand (and it’s an important hand, though it suggests physical deformity) travel cost a bunch back in 1967. I had an academic full ride offered at a Florida university – but when I looked at the cost of traveling to Florida, and compared it to in-state tuition and a small scholarship, MSU (with a $250/year scholarship) and UM (offering $450) were far more affordable. If I recall correctly, my checkbook for my first year of college showed $1,308 in expenses.
It’s a good idea to know where you rate – MIT and Cal Tech were always a cut above my performance – and besides, 1967 was a time when college students traveled by bus, not planes. What Flights Used to Cost in the ‘Golden Age’ of Air Travel provides this explanation:
“Part of the reason flying was so exclusive and relatively luxurious in the ’40s, ’50s, and ’60s was that it was very expensive. Until the Airline Deregulation Act of 1978, airlines were considered a public utility and airfares were set by the federal government, which ensured airlines always made more than enough money.
Even after deregulation, a basic domestic round-trip airfare in 1979 averaged $615.82 in today’s money. That average fare dropped to $344.22 by 2016.”
I wasn’t concerned about getting into an Ivy League school – the cost of travel pretty well kept them unavailable for LCHS graduates in 1967. Face it, Harvard is still a lot more accessible to a kid from Boston than a kid from Montana. And, as a ranch kid, the Land Grant colleges were more for my type of people
“In reality, 43% of Harvard’s white students are either recruited athletes, legacy students, on the dean’s interest list (meaning their parents have donated to the school) or children of faculty and staff (students admitted based on these criteria are referred to as ‘ALDCs’, which stands for ‘athletes’, ‘legacies’, ‘dean’s interest list’ and ‘children’ of Harvard employees). The kicker? Roughly three-quarters of these applicants would have been rejected if it weren’t for having rich or Harvard-connected parents or being an athlete.”
Turns out, Harvard students aren’t that smart after all | Tayo Bero | The Guardian“No one outside of the administration knew about the dean’s interest list or the similar director’s list — a group of select applications compiled by the director of admissions — until the SFFA lawsuit. But that hasn’t stopped the secret admissions practice from shaping Harvard’s student body for years. According to the Crimson, more than 10 percent of the Class of 2019 were on the two lists. Between 2010 and 2015, students placed on either list had a 42 percent chance of getting into Harvard, more than ten times the current acceptance rate.
SFFA’s filing referenced another little-known list called the “Z-List” — a “side door” to the elite university. Students on the list, who are often legacies, are guaranteed admittance but are asked to take a gap year before enrolling.
Peter Arcidiacono, a Duke professor of economics, used the data Harvard released during the SFFA lawsuit to reveal the university’s staggering preference for legacy students. His research found that a typical white applicant with a 10 percent chance of admission would see his odds rocket five-fold if he were a legacy and seven-fold if he were on the dean’s interest list. The data also accounts for advantages children of faculty have.
And it’s not just white students who benefit. Across every racial demographic, LDCs (legacy, Dean’s interest list or children of faculty) all enjoy higher admission rates. In fact, admission rates for Asian and Hispanic LDCs are 34 and 37 percent respectively, compared to 33 percent for whites. African-American LDCs have the lowest admission rate at 27 percent. On average, LDC admits also have slightly weaker applications than the typical admit. Harvard’s claim to meritocracy and their 4 percent admission rate is a myth. Once your family has reached the privileged legacy status, your race doesn’t matter. It might help you or hinder you in comparison to your other legacy competition, but not significantly. America’s “normal” students are the ones being hurt.”
https://thespectator.com/topic/age-legacy-student-admission-harvard-donorsSomehow, it seems to me like there has always been an affirmative action element to admission – it just wasn’t legally mandated, and went under the initials ‘ALDC.’ I knew it – heck, Teddy Kennedy was a Harvard graduate – and several of my classmates proved that they could successfully drive a car, drunk, across a longer bridge than Teddy attempted at Chappaquiddick. On that third hand, I do have a high regard for MIT and Cal Tech.
Still, higher education has spots for everyone – from community colleges to MIT. I won’t complain about my options – and I’m not ashamed of being a cow college graduate. I can’t imagine Harvard being a comfortable place for an aggie – regardless of color.
-
I ran across an interesting article at Brownstone Institute – it uses some terms that aren’t usually part of my vocabulary, and my writing here is basically just to provide enough of a condensed version to get folks to click the link and read what Brownstone developed. The article starts:
“According to economics textbooks, governments get their purchasing power by taking away currency from their populations and companies via taxation. In this textbook model, printing more currency with which to buy things and employ people is also a kind of taxation in which government can engage, because printing more money (all else fixed) increases the supply of money and thereby reduces the “price,” i.e., the purchasing power, of the currency already held by everyone else.
With no commensurate increase in the demand for money, the expansion in money supply created by American money-printing leads to all existing dollars buying fewer goods than before the money-printing. Nobody sends a bill: the tax just happens, with every clank of the government printing press. Doubling the amount of money in circulation via the printing press, and then giving the printed money to the government to buy stuff with, is basically the same as the government taxing half of private-sector income and buying stuff with it.
The implicit tax created by American money-printing can be avoided by simply not accepting dollars in exchange for labour and goods (and accepting instead, say, some other less-diluted currency, or goats. Or onions, for that matter). This is why runaway money-printing eventually leads to runaway inflation and an economic crash, as people flee from the inflated currency to avoid the implicit taxation.
Tributes to him who wields the mint
This implicit tax from money-printing is known in economics as a seigniorage tax, and it doesn’t apply only to a government’s citizens. In fact, if a lot of domestic currency is held abroad, then a lot of the seigniorage tax bill created by just printing money is paid by foreigners holding that currency.”
Seigniorage tax – well, seigniorage is the difference between the value of money and what it costs to produce it. Basically, seigniorage got a lot bigger when the country dropped gold and silver coins. Then, when the US dollar became the world’s reserve currency, our government could shift part of the seigniorage tax to other countries: the article lists them:

This is why inflation hasn’t hurt us too badly – the rest of the world is sharing the pain because they stock Yankee dollars without charging interest. The problem with relying on this system to keep our economy afloat is in the article:
“US GDP is about $23 trillion per year in the period covered in our table, while total federal government spending is around $7 trillion per year. So, if we include the Eurodollar market, foreign tributes have been worth almost 8 percent of GDP per year, or 25 percent of US government spending per year. This means that the US economy would crash spectacularly next year if these tributes were to come to an end. Without the tributes, the US government would have to increase taxes by as much as 25 percent, or axe an amount of spending equivalent to the entire US military (plus change), or find another way to cut spending 25 percent.”
Earlier, the authors provide this perspective (reprinted):
“The implicit tax created by American money-printing can be avoided by simply not accepting dollars in exchange for labour and goods (and accepting instead, say, some other less-diluted currency, or goats. Or onions, for that matter). This is why runaway money-printing eventually leads to runaway inflation and an economic crash, as people flee from the inflated currency to avoid the implicit taxation.”
The article is worth reading.
-
Previously, I wrote that the county health department has been
“treating the symptom, not the problem” and that instead of implementing what is effectively a group punishment, they should be trying to make it easier for people to do this right.This begs the question: How do we make it easier for people to properly dispose of non-household waste?
The major obstacle that keeps people from disposing of waste properly is the cost in gasoline and time. There are a few ways to address this:
- Reduce the cost/time
- Reimburse the cost/time
I believe a reimbursement program is probably not the best answer (costs being harder to estimate and less fixed), but the county certainly could put a bounty on used appliances or offer a reward to the person with the most non-household waste disposed of appropriately. Reimbursement is relatively easy in terms of logistics and design, provided the county is willing to throw money at the problem.
The more complicated method is cost reduction. How do we effectively bring the landfill to the people? Because ultimately, that’s what needs to happen to reduce the time/gas cost of using it.
Increasing the number of landfill sites (so that there was less time/distance involved in using them) would work, but would be expensive and would also require more landfill sites (which is itself not necessarily good).
Alternatively, sending someone around with a truck and a trailer to drive throughout the county, picking up non-household waste and transporting it would effectively bring the landfill to the people. Instead of having to load a vehicle, drive it, and unload it, the individual now has only to find the time to place the item at the end of their driveway and label it appropriately. There is no longer any benefit to the individual to misuse the green boxes- which means, misuse should decline dramatically
This has the obvious disadvantage of having junk piled at the ends of driveways- however it is a short-term problem with a long term gain of resolving junk accumulation throughout the county (something that the county evidently cares about, given the community decay ordinance). This disadvantage might be addressed by focusing on a different type of junk each month- tires in May and appliances in June or something like it.
It seems that the county will be spending money on this, so if we’re going to be paying for it anyway, we really ought to make sure our money goes to actually dealing with the problem.
Previously:
Treating the Symptom, not the Problem
The county health department has proposed several “solutions” to the problem of inappropriate materials being disposed of at the green boxes (see last week’s Tobacco Valley News). Two out of three of those “solutions” will remove the Trego greenboxes, while all three include a budget increase for the health department. There are some issues with these, beyond the obvious “fewer services for more money”. First, none of the Health Department’s proposed solutions actually address the problem they are trying to solve. Second, they are trying to solve the wrong problem. The problem the health department is trying to solve is…
Keep reading -
Occasionally I see articles explaining how the 17th Amendment – direct election of senators – conflicts with the intent of the founders. Years ago, I heard the argument that Senators represent the individual state’s sovereignty, rather than the residents (why the Senate is not based on population) and, if that argument is solid, there is an equally solid argument that taking the selection of Senators from the legislature does conflict with the ideas of the founders. A Democrat Senator from Montana, William A. Clark, had enough bribery and chicanery in getting into office that, at the least, he had a significant role in getting the 17th Amendment passed. Sharlot Hall Museum offers a few comments on our Senator Clark:
“Born in Pennsylvania in 1839, W. A. Clark served briefly in the Confederacy during the Civil War but deserted in 1862 to try mining, first in Colorado, then in Montana in 1863. After moderate success, Clark realized money could be made as a teamster transporting scarce groceries like eggs and tobacco to Montana mining towns. At a time when a miner’s monthly salary was four dollars, Clark’s eggs were three dollars a dozen and he made a tidy profit. . . . Back in Montana, Clark’s success attracted competitors, and soon Marcus Daly struck a seam of copper fifty feet wide and created the Anaconda Copper Company in Butte. The two men were economic and political rivals for years.
Both desired to become U.S. Senators after Montana became a state in 1889. Senators were chosen by the state legislature, so both Daly and Clark lobbied for votes. Neither won a majority, so Clark decided to simply “buy” the legislators. Proof of bribes was obtained by authorities in Washington, D.C., but the Montana legislators elected Clark anyway. The U.S Senate initially refused to seat Clark. This incident and others like it led to the 17th Amendment in 1914 mandating popular election of senators.”
Mark Twain said, “Clark is as rotten a human being as can be found anywhere….to my mind he is the most disgusting creature the American republic has produced since Boss Tweed’s time.”
William Clark is still in the official US Senate Records – with his own webpage: U.S. Senate: The Election Case of William A. Clark of Montana (1900) :
Background
In 1890 Montana copper mining czar William A. Clark failed in his first effort to become a United States senator. Undaunted, Clark continued to devote the full measure of his extensive economic and political power to achieving that goal. Enormous sums of money changed hands in Montana as Clark and his chief rival, Anaconda Company copper magnate Marcus Daly, sought to influence the economic structure of the state, the location of the capital, the direction of Democratic politics, and the selection of a United States senator. The blatant business and political competition between the Clark and Daly factions was but a continuation of the turmoil that had marred Montana politics since the organization of the state government in 1889.Statement of the Case
Nine years after his initial disappointment in 1890, William Clark won the Senate seat he so avidly desired, presenting his credentials on December 4, 1899. The Senate admitted him immediately, although on the same day his opponents filed a petition charging that Clark had secured his election through bribery. The memorial asserted that Clark had spent far more on his election than the $2,000 permitted by an 1895 Montana law aimed at controlling political corruption. The Senate referred the matter to the Committee on Privileges and Elections, which quickly asked for and received authorization to conduct a full investigation into Clark’s election.Response of the Senate
On April 23, 1900, after hearing extensive testimony from ninety-six witnesses, the committee returned a report unanimously concluding that William Clark was not entitled to his seat. The testimony detailed a dazzling list of bribes ranging from $240 to $100,000. In a high-pressure, well-organized scheme coordinated by Clark’s son, Clark’s agents had paid mortgages, purchased ranches, paid debts, financed banks, and blatantly presented envelopes of cash to legislators. In addition, the winning margin in Clark’s election had been secured by the votes of eleven Republican legislators under suspicious circumstances. Clark did not enhance his position when he admitted that he had destroyed all his personal checks that dealt with campaign transactions. The committee cited a number of previous bribery cases, especially that of Samuel C. Pomeroy and Alexander Caldwell in 1872-1873, as precedents for declaring an election void if bribery on behalf of the winner could be proved even if no proof was found that the candidate knew of the actions. The report also noted the precedent from the Pomeroy case that, if the winner “clearly participated in any one act of bribery or attempted bribery, he should be deprived of his office,” even if “the result of the election was not thereby changed.” While concurring in the committee’s conclusion, two members tried to reduce the impact of the anti-Clark testimony by pointing to the unlimited sums that his rival, Marcus Daly, had invested in an effort to block Clark’s election. That observation, however, did little more than confirm the way in which corruption totally pervaded Montana politics without exonerating Clark.On May 15, 1900, as the Senate prepared to vote on Clark’s right to retain his seat, the beleaguered senator rose to speak. Predictably, Clark complained about the procedures of the committee, the admissions and omissions of evidence, and the machinations of Marcus Daly. He contended that the Senate had lost sight of the principle of presumption of innocence and concluded that the committee had not shown that bribery sufficient to alter the election results had occurred. At the conclusion of his remarks, Clark, clearly aware that he did not have the necessary votes to keep his seat, resigned.
This did not conclude the Montana case, for on May 15 the acting governor of Montana immediately appointed Clark to fill the Senate vacancy. When the governor learned of this action on his return to the state three days later, he telegraphed the Senate that Martin Maginnis would fill the Clark vacancy. Credentials for both Clark and Maginnis were presented to the Senate, which ordered them to lie on the table.
Conclusion
In January 1901 a newly elected Montana legislature—in which most of the winning candidates had received financial support from William Clark—elected him to the Senate for the same term he had filled earlier. Marcus Daly had died in November 1900, and this time no charges of corruption were raised. On March 4, 1901, Clark appeared and was seated without objection.In this case, the Privileges and Elections Committee stressed that the Senate had a duty to itself and to the country to demonstrate by its action that senators cannot retain seats procured by corruption. It also saw an equal duty to Montana because the state had adopted the 1895 law in an effort to end corruption in its elections.
William Clark, having finally achieved his great ambition, served one term as United States senator. He retired from the Senate in 1907 and returned to his far-flung business ventures. While remaining notorious for the corruption of his 1899 election, Clark continued to add to his vast fortune. He died in 1925.
Source: Adapted from Anne M. Butler and Wendy Wolff. United States Senate Election, Expulsion, and Censure Cases, 1793-1990. S. Doc. 103-33. Washington, GPO, 1995.
His daughter, Huguette Clark, died in 2011, at the age of 104. With her death, the last fortune of the “Copper Kings” was disbursed/


Want to tell us something or ask a question? Get in touch.

Recent Posts
- Recovery Time for a Retiree
- Venn Diagram and DSM
- When Castro Was Cool
- You Have To Beat Darwin Every Day
- Computer Repair by Mussolini
- Getting Alberta Oil to Market
- Parties On Economics
- Thus Spake Zarathustra – One More Time
- Suspenders
- You Haven’t Met All The People . . .
- Play Stupid Games, Win Stupid Prizes
- The Ballad of Lenin’s Tomb

Rough Cut Lumber
Harvested as part of thinning to reduce fire danger.
$0.75 per board foot.
Call Mike (406-882-4835) or Sam (406-882-4597)
Popular Posts
Ask The Entomologist Bears Books Canada Census Community Decay Covid Covid-19 Data Deer Demography Education Elections Eureka Montana family Firearms Game Cameras Geese Government Guns History Inflation life Lincoln County Board of Health Lincoln County MT Lincoln Electric Cooperative Montana nature News Patches' Pieces Pest Control Politics Pond Recipe School School Board Snow Taxes travel Trego Trego Montana Trego School Weather Wildlife writing
